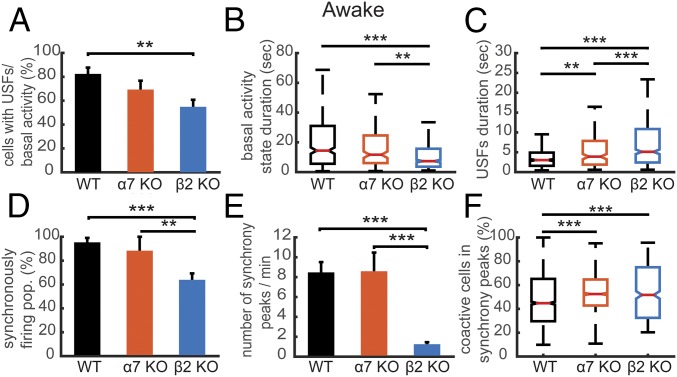
Fig. 3.
Comparison of the properties of USFs and synchronicity in awake mice. (A) Percentage of cells with USFs for each animal type in the awake state. (B) Boxplots of basal activity durations for each animal type in the awake state. (C) Boxplots of USF durations for each animal type. (D) Percentage of populations exhibiting synchronous activity for each mouse type in the awake state. (E) Mean number of synchrony peaks per minute for the different animal groups in the awake state. (F) Percentage of coactive cells in the peaks of synchrony for the different animal groups in the awake state. For all comparisons: *P < 0.05, **P < 0.01, and ***P < 0.001; ANOVA in A, D, E, and F; Kruskal–Wallis in B and C.

