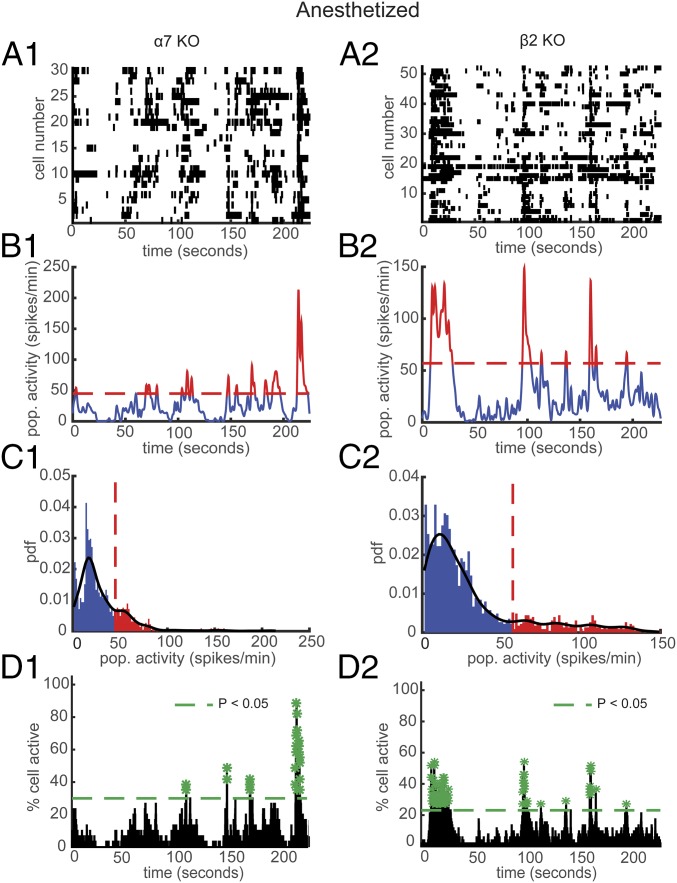
Fig. 4.
Effect of general anesthetic on USFs and synchronously firing neurons in α7 and β2 KO mice. (A) Representative rasterplots for one population of simultaneously recorded neurons in α7 (A1) and β2 KO (A2) anesthetized mice. (B) Mean neural activity for the populations in A in α7 (B1) and β2 KO (B2) anesthetized mice. Red and blue correspond to USFs and basal activity states, respectively. Dotted red line: computed threshold. (C) Probability density function (pdf) of the population activity in B in α7 (C1) and β2 KO (C2) anesthetized mice. (D) Histogram representing the percentage of cells active in small time bins (∼0.144 s) for the population activity in A in α7 (D1) and β2 KO (D2) anesthetized mice. Asterisks: significant peaks of synchrony. (A1–D1) α7 KO and (A2–D2) β2 KO mice.

