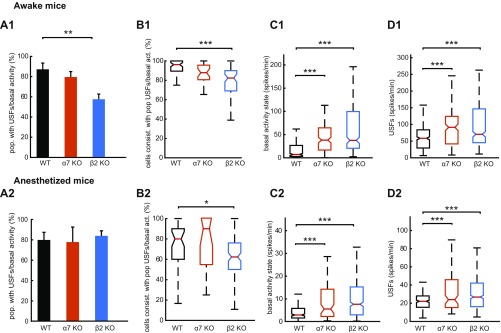
Fig. S2.
Properties of USF transitions in awake and anesthetized mice. (A) Computed percentage of populations that exhibit USFs for each animal type in the awake (A1) and anesthetized state (A2). β2 KO mice have a significantly lower proportion of populations that exhibit USFs compared with WT animals in the awake state. (B) Percentage of cells consistent with populations that exhibit USFs for each animal type in the awake (B1) and anesthetized states (B2). In β2 and α7 KO animals, less cells are consistent with populations that exhibit USFs compared with WT mice in the awake state, whereas in the anesthetized state only β2 KO are significantly different from WT mice (P = 0.005). (C) Boxplots of basal activity states for each mouse type (spikes per minute) in the awake (C1) and anesthetized states (C2). β2 and α7 KO animals exhibit significantly higher basal activity compared with WT mice for both the awake and anesthetized state. (D) Boxplots of USFs for each mouse type (spikes per minute) in the awake (D1) and anesthetized states (D2). β2 and α7 KO animals exhibit significantly higher USFs compared with WT mice for both awake and anesthetized state. (A1–D1) Awake and (A2–D2) anesthetized mice. *P < 0.05, **P < 0.01, and ***P < 0.001; ANOVA in A; Kruskal–Wallis in B–D.

