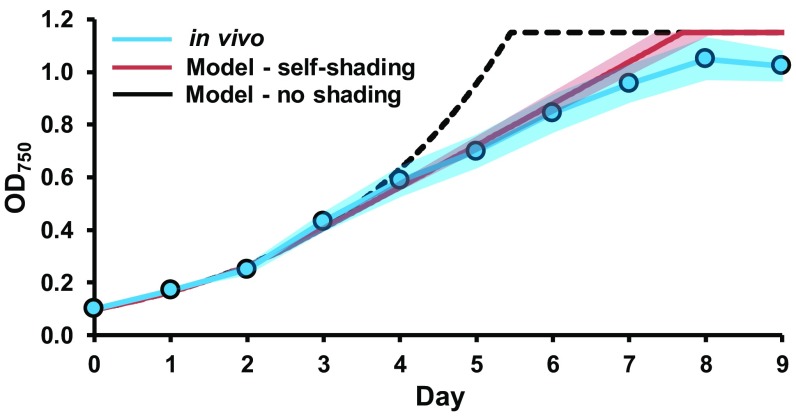
Fig. 2.
Modeling the self-shading of cultures increases the accuracy of growth rate prediction. OD750 values for the in vivo culture were the mean of three individual cultures. SE is represented by the shaded areas. SE for the in silico growth rate was determined from the SE of the in vivo inputs to the model.

