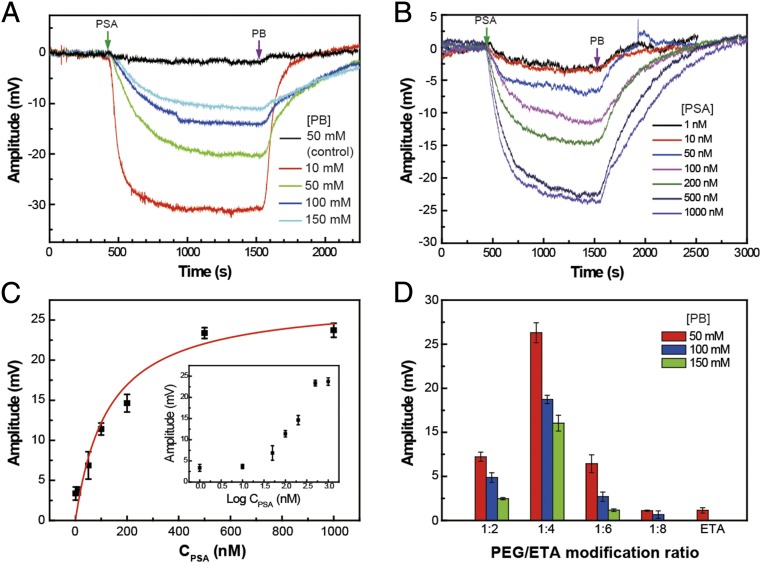
Fig. 3.
Nonspecific PSA detection in high–ionic-strength solutions. (A) PB concentration-dependent PSA signal amplitude vs. time data recorded from ETA-modified (control) and ETA/PEG-modified devices. The black trace represents the response of the ETA-modified devices. The PSA concentration in all experiments shown in A was 100 nM. (B) Time-dependent signal response traces at different PSA concentrations for a PEG-modified graphene FET sensor in 100 mM PB. (C) Plot of the sensor response vs. PSA concentration. The red line is fit of the data with Langmuir adsorption isotherm with k = 7.9 × 10⁶ M−1. The Inset shows the sensor response (in millivolts) vs. logarithm of the PSA concentration. The PEG:ETA modification ratio in A, B, and C was 1:4. (D) Signal amplitude dependence on the ratio between PEG and ETA in the modification layer. All experiments were carried out below the PSA isoelectric point in pH 6 PB. The error bars in C and D represent the SD from three independent devices on the same device chip.

