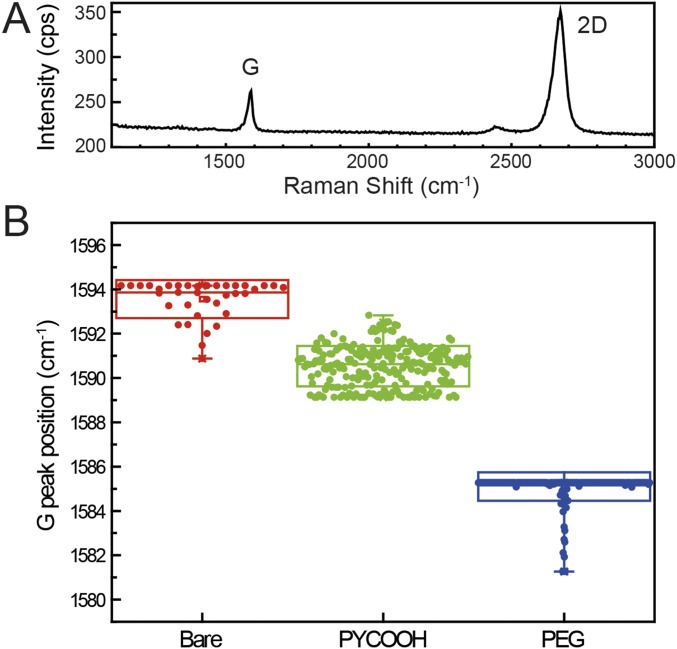
Fig. S2.
Raman characterization of graphene before and after surface modification steps. (A) Raman spectrum of bare graphene, where the graphene was transferred to a SiO2/Si substrate. The G and 2D bands (SI Text) are highlighted. (B) Box plots of Raman G peak shift before and after PYCOOH and PEG modifications measured from a 10 × 10-μm2 graphene region. The highest and lowest horizontal lines in the boxes represent SD, whereas the middle line represents the mean value. The vertical lines highlight the maximum and minimum values. The average G peaks of pristine graphene (red), PYCOOH-modified graphene (green), and PEG-modified graphene (blue) are located at 1,594, 1,591, and 1,585 cm−1, respectively. The downshift of the G band indicates electron doping due to the PYCOOH and then PEG modification steps. Raman spectra were acquired with a LabRam Evolution Multiline Raman Spectrometer (Horiba) equipped with 600 blaze/mm grating and a 100× microscope objective lens (numerical aperture of 0.95) and 532-nm wavelength continuous-wave diode laser.

