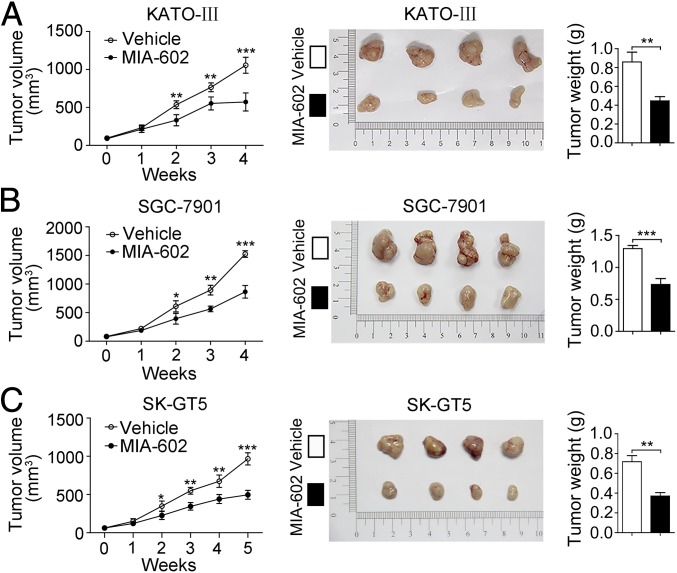
Fig. 3.
Inhibition of gastric tumor growth in vivo by MIA-602. (A–C, Left) Tumor growth curves of KATO-III (A), SGC-7901 (B), and SK-GT5 (C) models (n = 12 in each group) treated with MIA-602 administration or vehicle. (Center) Tumors were harvested at the end of the experiments. (Right) The average weights of tumors derived from treatment with MIA-602 (filled bar) or control (open bar). Error bars indicate SEM. *P < 0.05, **P < 0.01, ***P < 0.001 by Student’s t test.

