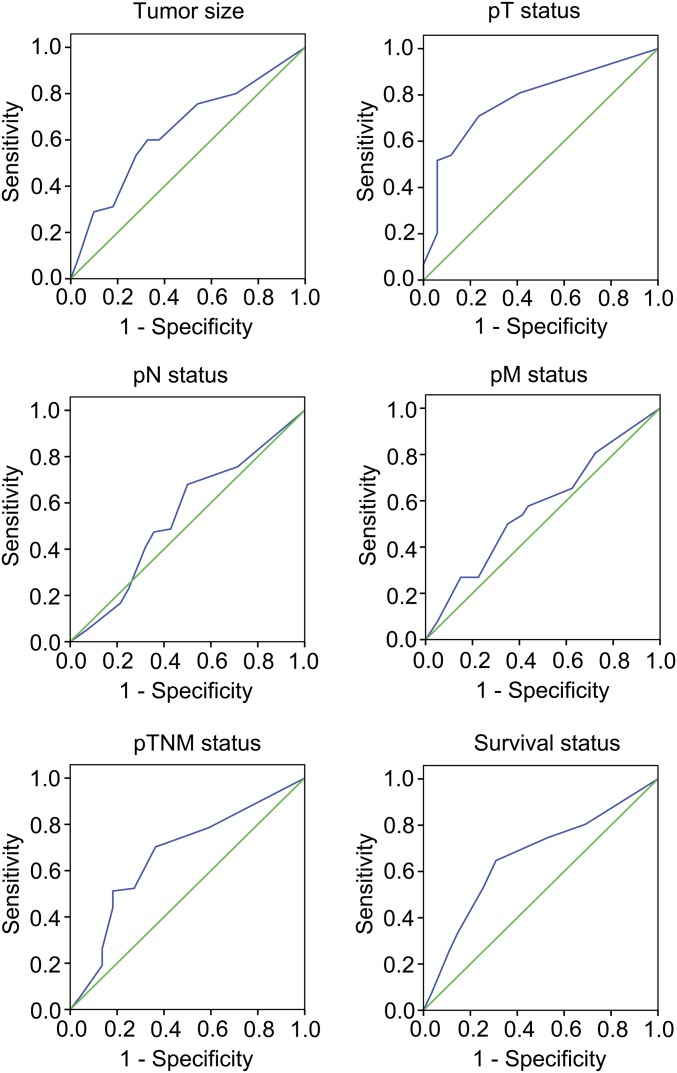
Fig. S1.
ROC curve analysis was used to determine the cutoff score for the overexpression of GHRH-R. The sensitivity and specificity for each clinical outcome were plotted. Immunohistochemistry-stained samples were split into groups with high (n = 50) and low (n = 56) GHRH-R expression by ROC analysis. The blue trace represents ROC curve and the green trace represents diagonal reference line.

