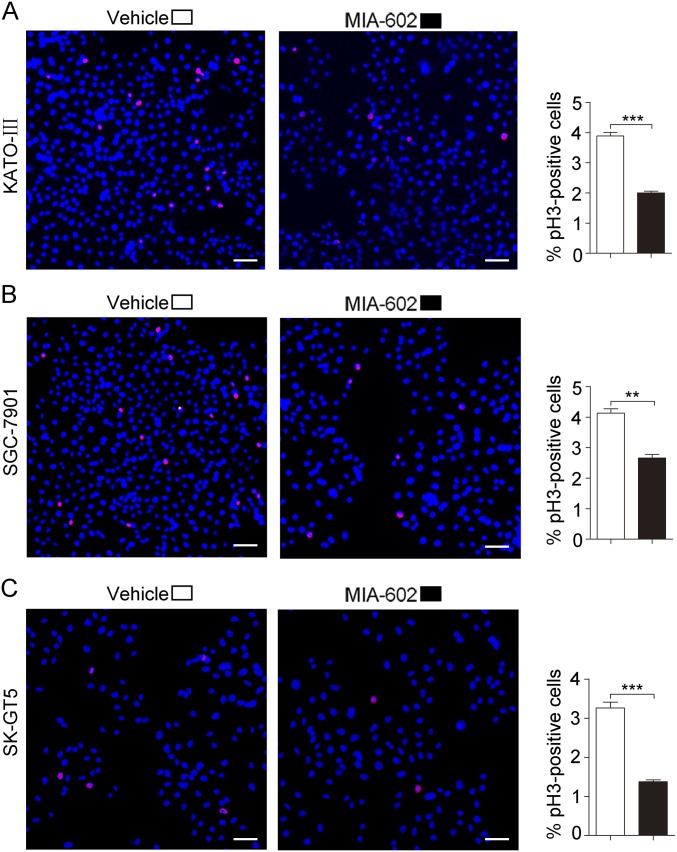
Fig. S3.
The expression of pH3 in GC cells was decreased by MIA-602 treatment. (Left) Representative images of immunofluorescence analysis of pH3 in KATO-III (A), SGC-7901 (B), and SK-GT5 (C) cells. (Right) The percentages of pH3+ cells in treated (filled bars) and untreated (open bars) cells were plotted. (Scale bars, 200 μm.) Error bars indicate SEM. **P < 0.01, ***P < 0.001 by Student’s t test; n = 3 in each group.

