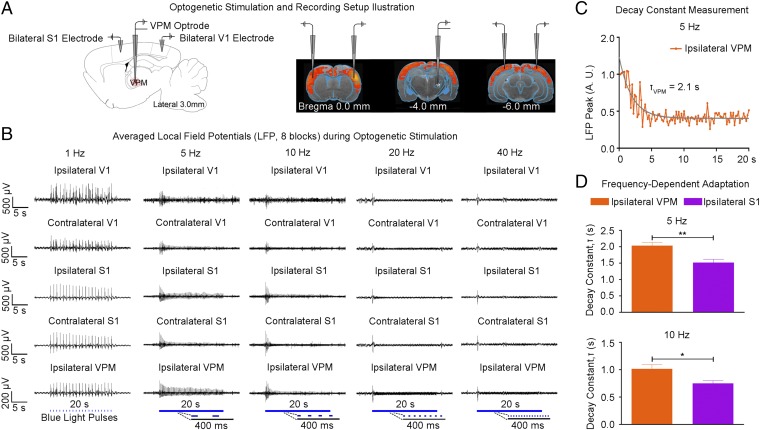
Fig. 3.
LFP recordings in sensory cortices and VPM confirm neuronal activity underlying BOLD activation and indicate adaptation at the thalamic and cortical levels. (A) Illustration of the location of recording electrodes in bilateral S1BF, bilateral V1, and optrode in VPM. (B) Averaged LFP from a representative animal during VPM optogenetic stimulation (eight blocks; 1 Hz, 10% duty cycle; 5, 10, 20, and 40 Hz, 30% duty cycle). Response levels of evoked LFPs remained fairly constant at 1 Hz. However, evoked LFPs decreased quickly during the initial consecutive pulses at 5–40 Hz. These LFP recordings were consistent with the observed BOLD responses. (C) Adaptation characterization at ipsilateral VPM during 5 Hz of optogenetic stimulation. Adaptation was quantified by normalization of the amplitudes of positive peaks at each of the evoked potentials to the amplitude of the first positive peak, which was then fitted with a monoexponential decay curve to quantify its decay constant, τ. (D) There was additional adaptation in ipsilateral S1 at 5 Hz (τVPM = 2.10 ± 0.15 s vs. τS1 = 1.50 ± 0.17 s; error bar indicates SD; paired t test with post hoc Holm–Bonferroni correction; **P < 0.01) and 10 Hz (τVPM = 1.00 ± 0.13 s vs. τS1 = 0.73 ± 0.11 s; *P < 0.05). This finding indicates that the observed adaptation involved interactions within the thalamo-cortico-thalamic network and was not solely from sustained VPM membrane depolarization.

