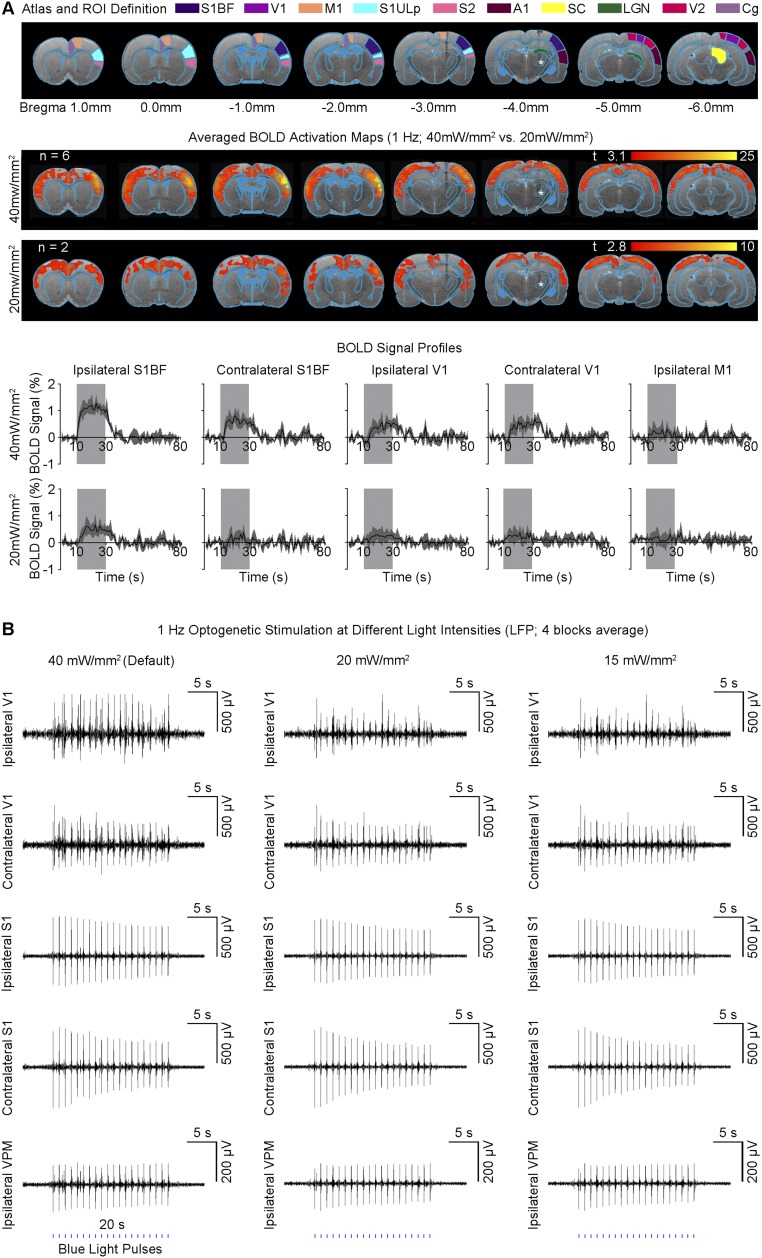
Fig. S3.
Low light intensity during 1 Hz of optogenetic VPM stimulation does not change the overall BOLD brain-wide activation and LFP response characteristics. (A, Top) Illustration of Paxinos atlas-based ROI definitions. S1BF: primary somatosensory barrel field; V1: primary visual cortex; M1: motor cortex; S1ULp: primary somatosensory upper lip area; S2: secondary somatosensory cortex; A1: primary auditory cortex; SC: superior colliculus; LGN: lateral geniculate nucleus; V2: secondary visual cortex; Cg: cingulate cortex. (Middle) Averaged BOLD activation maps during 1 Hz of optogenetic stimulation at 40 mW/mm2 (n = 6) and 20 mW/mm2 (n = 2). Lower threshold of P < 0.01 with t = 2.8 was used to display the relatively weak BOLD activations at 20 mW/mm2. (Bottom) BOLD signal profiles of bilateral S1BF, bilateral V1, and ipsilateral M1 extracted from ROIs defined in A (error bar indicates ± SEM). In general, the spatial extent of cortical BOLD activations was observed to remain largely similar when light intensity decreased. Furthermore, the absolute BOLD signal amplitudes in activated regions such as bilateral S1BF and V1 were shown to decrease with the reduced light intensity. (B) LFPs were recorded at three different light intensities (n = 1; Left) default: 40 mW/mm2. (Middle) 20 mW/mm2. (Right) 15 mW/mm2. Secondary peaks evoked in bilateral V1 were observed to increase with light intensity. However, the primary optogenetic response levels did not show apparent changes in characteristics.

