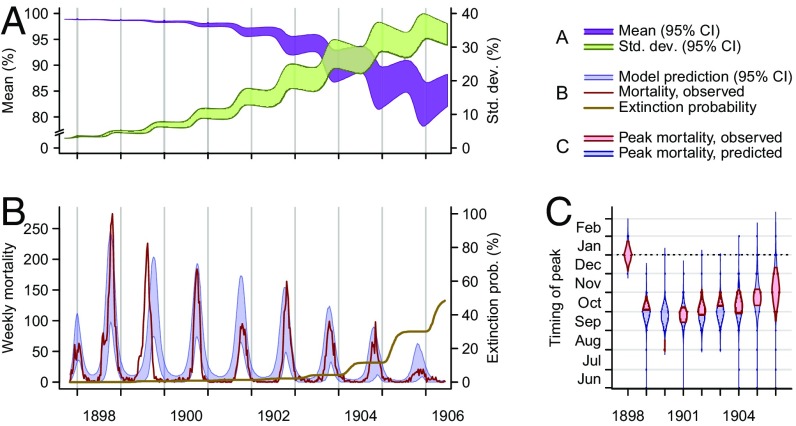
Fig. 4.
Epidemic dynamics in Belagavi. (A) Model-predicted mean susceptibility in the population [purple band, 95% credible interval (CI)] undergoes seasonal decreases along the course of the epidemic, and the SD of susceptibility in the population (green band, 95% CI) increases as the density of rats with susceptibility lower than one increases. (B) Model-predicted (blue band, 95% CI) and observed (red line) plague mortality cycles seasonally, decreasing as the mean susceptibility in the population decreases. The model-generated cumulative probability for plague extinction (brown line) increases near the end of the epidemic. The last season of epidemic disease in Belagavi was the 1905–1906 season. (C) Model-predicted posterior probability density (blue violin plot) and observed (red interval) timing of peak mortality. The epidemic in Belagavi began out of phase and rapidly adjusted to the season, a pattern the model recapitulates. Bands and violin plots represent central tendencies of the range across 2,000 stochastic simulations, discarding 968 simulations in which extinction occurred.

