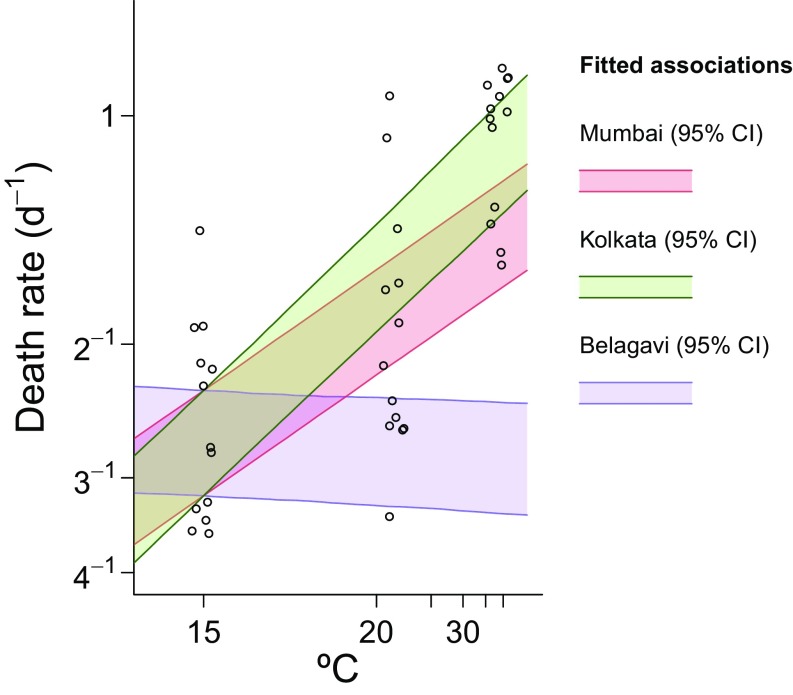
Fig. S2.
Environmental forcing of flea survival in the model without evolution. Ninety-five percent credible intervals (CI) for the model-fitted relations between flea death rates and temperature are plotted, adjusting for differences among intercepts (baseline) in flea survival across cities and in the experiment to account for shorter observed flea survival under experimental conditions. Points represent experimental data and are jittered along the x axis from the original temperatures (16 °C, 21 °C, and 38 °C) to avoid overplotting. The model fitted without accounting for evolution provides poorer fit to experimental data compared with the model fitted with direct evolutionary mechanisms (Tables S6 and S7).

