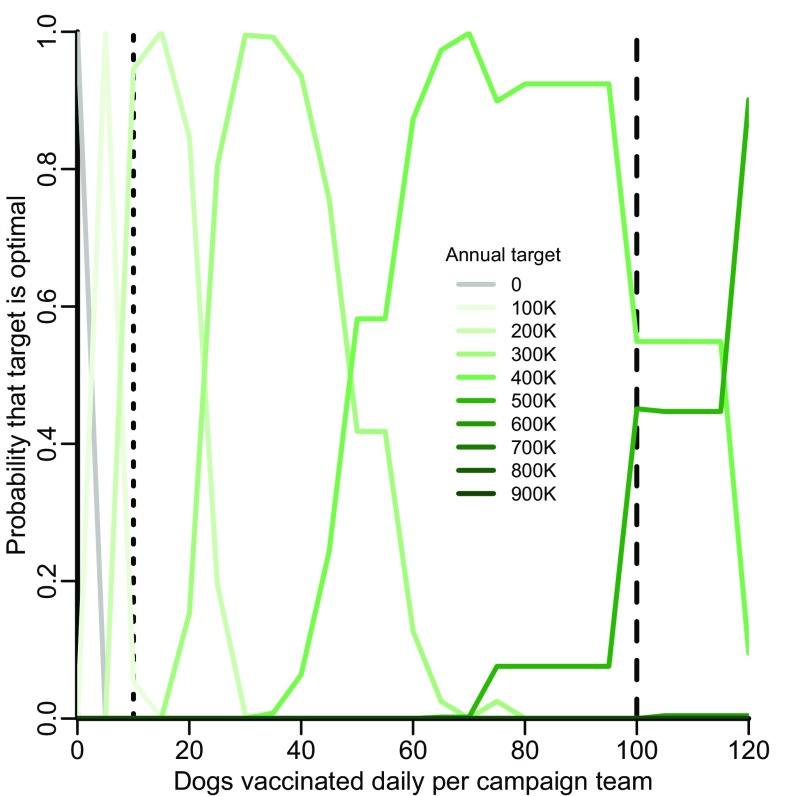
Fig. S3.
Sensitivity analysis on the optimal target for central point vaccination campaigns given the daily number of dogs able to be vaccinated by the team. Acceptability curves delineate the probability that a strategy is optimal. For each of 1,000 predictive simulations, only one strategy can be optimal at a given daily rate—but that optimal strategy may vary from simulation to simulation as a consequence of sampling from parameter uncertainty. Each curve depicts the probability that a strategy would confer the greatest net health benefit across a range of daily rates estimated by the proportion of simulations in which that strategy was optimal at each rate. Rabies control strategies evaluated include maintenance of the status quo (gray lines) and expanding targets for owned canine vaccination (green lines of progressively deeper shades). The vertical dotted and dashed lines indicate the rate observed for stray capture campaigns elsewhere in India and the central point rate observed in Malawi (10 and 100 dogs vaccinated daily), respectively.

