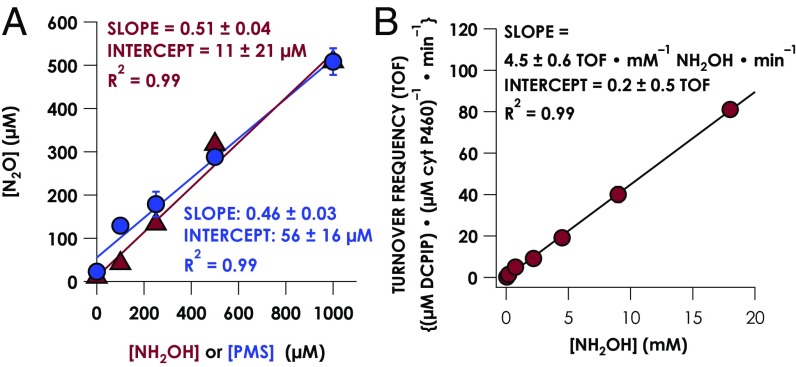
Fig. 2.
(A) Stoichiometry of N2O production by cyt P460 determined with GC. Data points are averages of triplicate trials with 5 μM ferric cyt P460 in anaerobic 50 mM Hepes, pH 8.0, at 25 °C overnight. Error bars represent 1 SD of three trials. For the red triangles, the concentration of PMS is held at 1 mM, whereas the NH2OH concentration is varied; for the blue circles, the NH2OH concentration is held at 1 mM, whereas PMS concentration varies. (B) Steady-state NH2OH oxidase activity plot for cyt P460. The assay conditions were 1 μM cyt P460, 6 μM PMS, and 100 μM DCPIP with various NH2OH concentrations in anaerobic 50 mM Hepes, pH 8.0, at 25 °C. Each data point is the average of three trials, with error bars representing one SD.

