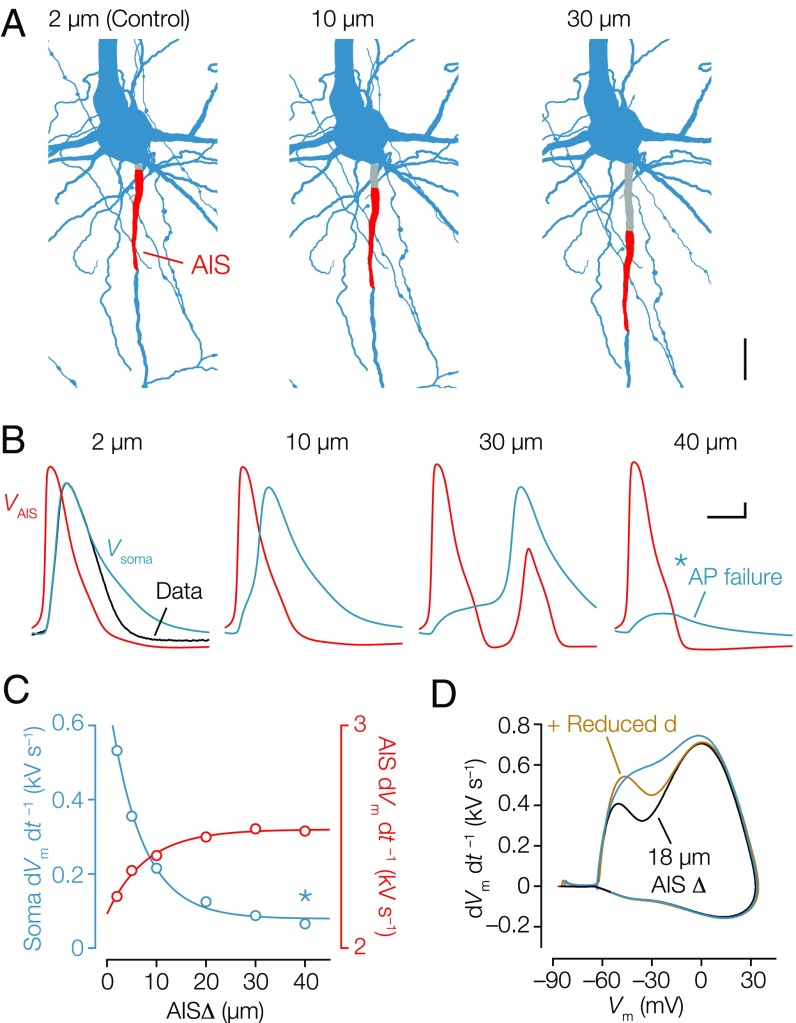
Fig. 5.
Dendritic morphology and AIS distance in a realistic compartmental model normalize the somatic AP. (A) Part of the morphological reconstruction encompassing soma, proximal basal and apical dendrites (blue), and the AIS (red) used in compartmental modeling. The AISΔ of 2 µm represents the control morphology. Alternative models were made with increasing AISΔ (gray). (Scale bar: 20 µm.) (B) Simulation of single APs at the soma (blue) overlaid with the experimentally recorded AP as constraint (black) and corresponding simulated AP waveform in the distal AIS (red). Somatic and AIS APs for different AISΔ values. Note the failure of somatic (but not axonal) AP generation with a 40-µm AISΔ. (Scale bar: 0.1 ms, 10 mV.) (C) First dVm dt–1 of the somatic APs (blue) and the peak dVm dt–1 of the AIS AP (red). Data series are fitted with single exponential functions. *Somatic AP failure. (D) Phase plot of the simulated APs showing how adjusting AISΔ to 18 µm reduced the first dVm dt–1 by ∼179 V s–1. Decreasing the somatodendritic compartment by 30% sufficed to recover the amplitude in the first dVm dt−1.

