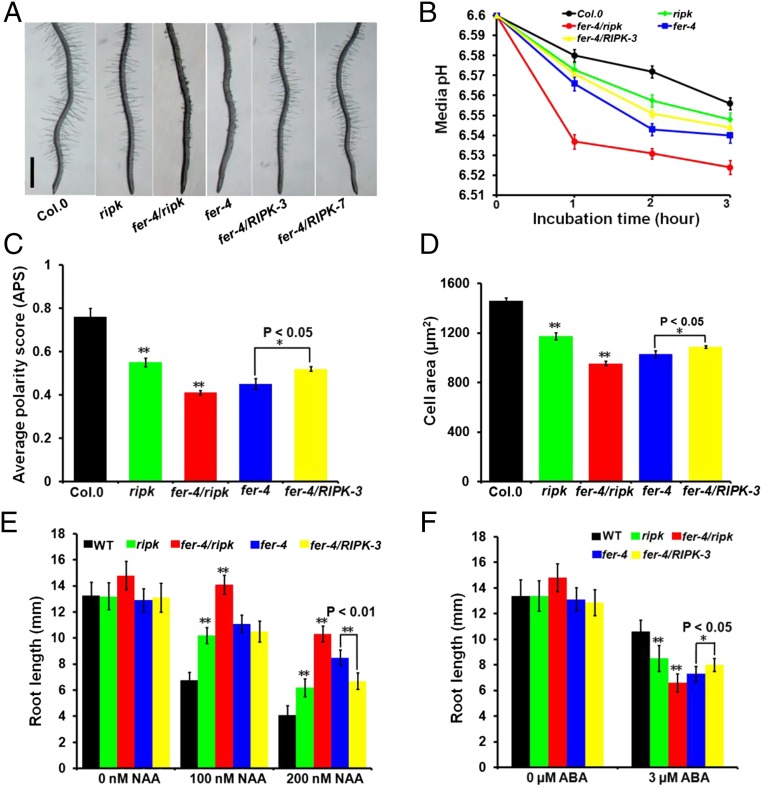
Fig. 2.
RIPK loss-of-function mutants mimic fer-4 mutants in genetic phenotypes. (A) Root-hair phenotype in Col.0, ripk-Col.0, fer-4/ripk, fer-4, and fer-4/RIPK plants. Photo shows 7-d-old Arabidopsis seedlings vertically grown on 1/2 MS plate. (Scale bar, 1 mm.) (B) Quantitative assay of the rhizosphere acidification rate in Col.0, ripk-Col.0, fer-4/ripk, fer-4, and fer-4/RIPK plants using a pH indicator, fluorescein-Dextran conjugate. Values represent the means ± SD obtained from three biological replicates (n = 7 seedlings). (C) Average polarity score (APS) of epidermal pavement cells from 7-d-old seedlings was determined. Values represent averages ± SD (n = 15 cells). (D) Area of epidermal pavement cells in Col.0, ripk-Col.0, fer-4/ripk, fer-4, and fer-4/RIPK leaves. Values represent averages ± SD (n = 15 cells). (E) Root length comparison of Col.0, ripk-Col.0, fer-4/ripk, fer-4, and fer-4/RIPK plants under different NAA concentrations (0, 100, and 200 nM) and treatments. Values represent the means ± SD obtained from three biological replicates. (F) Root length comparison of Col.0, ripk-Col.0, fer-4/ripk, fer-4, and fer-4/RIPK plants under different ABA concentrations (0, 3 µM) and treatments. Values represent the means ± SD obtained from three biological replicates. In C–F, asterisks indicate significant difference from the control as determined by one-way ANOVA (**P < 0.01 and *P < 0.05).

