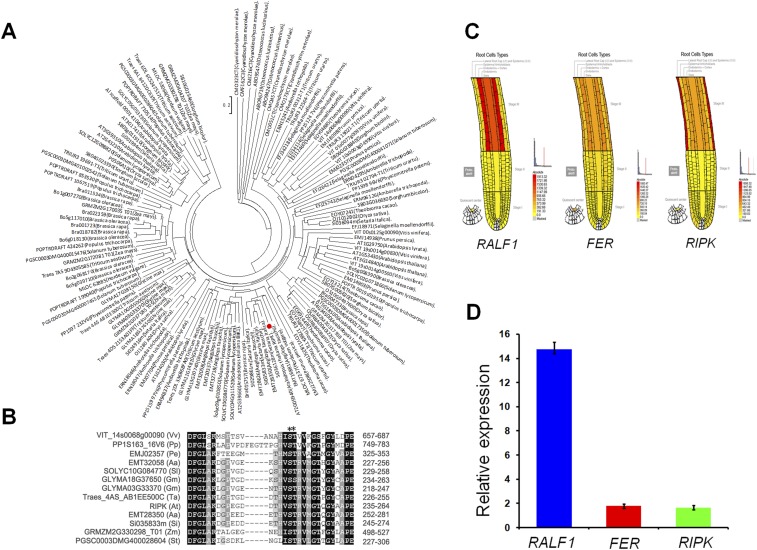
Fig. S2.
Phylogenetic analysis of RIPK and expression profiles of RALF1, FER, and RIPK. (A) Phylogenetic tree of RIPK and related homologs from different plant species was constructed by neighbor-joining method using ClustalX (version 1.8) and MEGA 4.0. The bootstrap values (1,000 replicates) are indicated. The length of the branch is proportional to the degree of divergence. (B) Conserved sequence alignment of RIPK and related homologs from different plant species. An asterisk indicates conserved phosphorylation sites. (C) Expression profiles of RALF1 (Left), FER (Middle), and RIPK (Right) show that they are preferentially expressed in the root hair zone of roots. The data are from Botany Array Resource. Signal threshold was set to 2,000 for the data extraction. (D) Quantitative RT-PCR analysis for RALF1, FER, and RIPK expression in roots. Three independent experiments were done with similar results.

