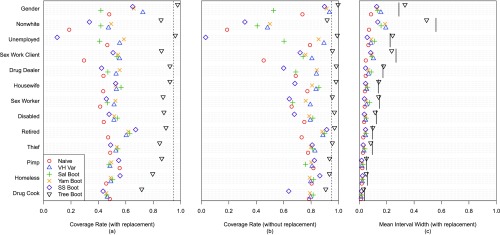
Fig. 2.
Estimating population proportions via RDS with the Project 90 data. Coverage probabilities and widths of 95% confidence intervals estimated by the following methods: (i) the naive proportion variance estimator; (ii) the Volz–Heckathorn variance estimator; (iii) the Salganik bootstrap; (iv) the Yamanis bootstrap; (v) the Gile successive-sampling bootstrap; and (vi) the tree bootstrap. For the coverage probabilities and widths in A and C, sampling was performed with replacement, and for the coverage probabilities in B, sampling was performed without replacement. Attributes are in decreasing order of prevalence in the network. The dashed vertical black lines in A and B are at 0.95, so that for a perfectly calibrated method, the symbol would lie on the line. The short black lines in C are the expected 95% interval widths based on 10,000 simulated samples.

