
Fig. S1.
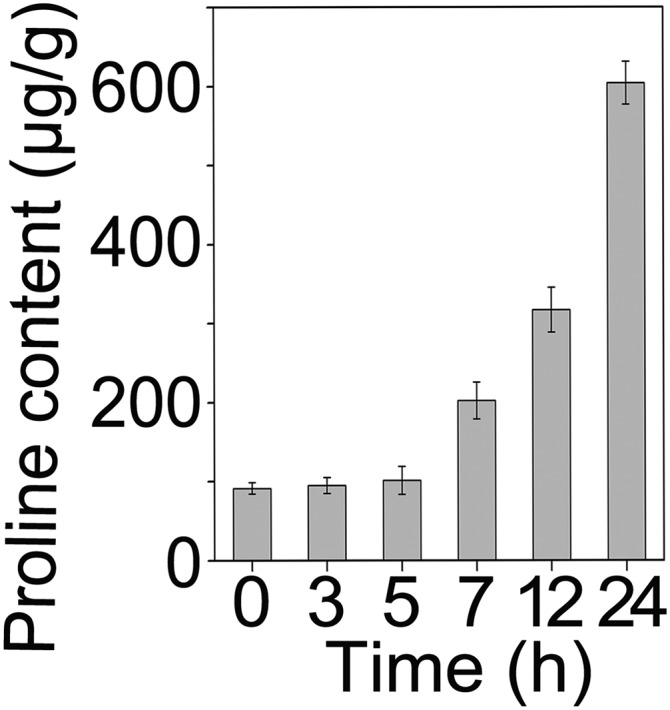
Time course of proline accumulation under 200 mM NaCl. Data are shown as mean ± SEM (n = 3). More than three biological replicates were performed and one representative is shown.
Official websites use .gov
A
.gov website belongs to an official
government organization in the United States.
Secure .gov websites use HTTPS
A lock (
) or https:// means you've safely
connected to the .gov website. Share sensitive
information only on official, secure websites.
Time course of proline accumulation under 200 mM NaCl. Data are shown as mean ± SEM (n = 3). More than three biological replicates were performed and one representative is shown.