
Fig. S4.
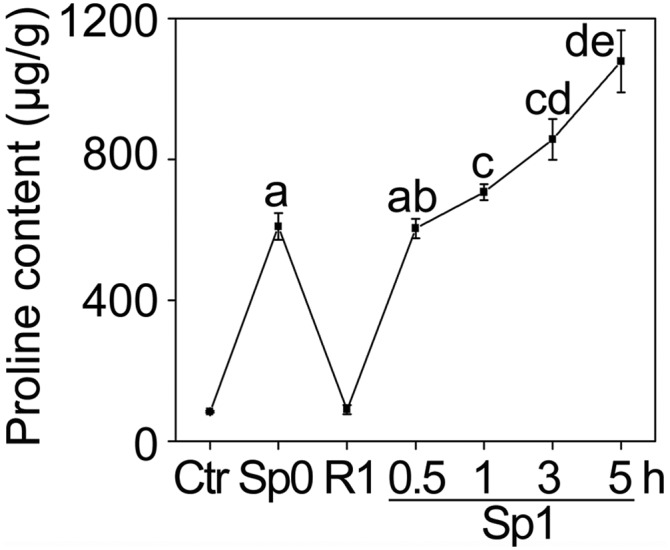
Memory response of proline accumulation after salt pretreatment for different times. Plants were pretreated for different hours and proline content in Ctr, Sp0, R1, and Sp1 were measured. Different letters on the value indicate statistical significance based on Student’s t test. The experiment was repeated at least three times. The representative experiment shown indicates the mean ± SEM (n = 3).