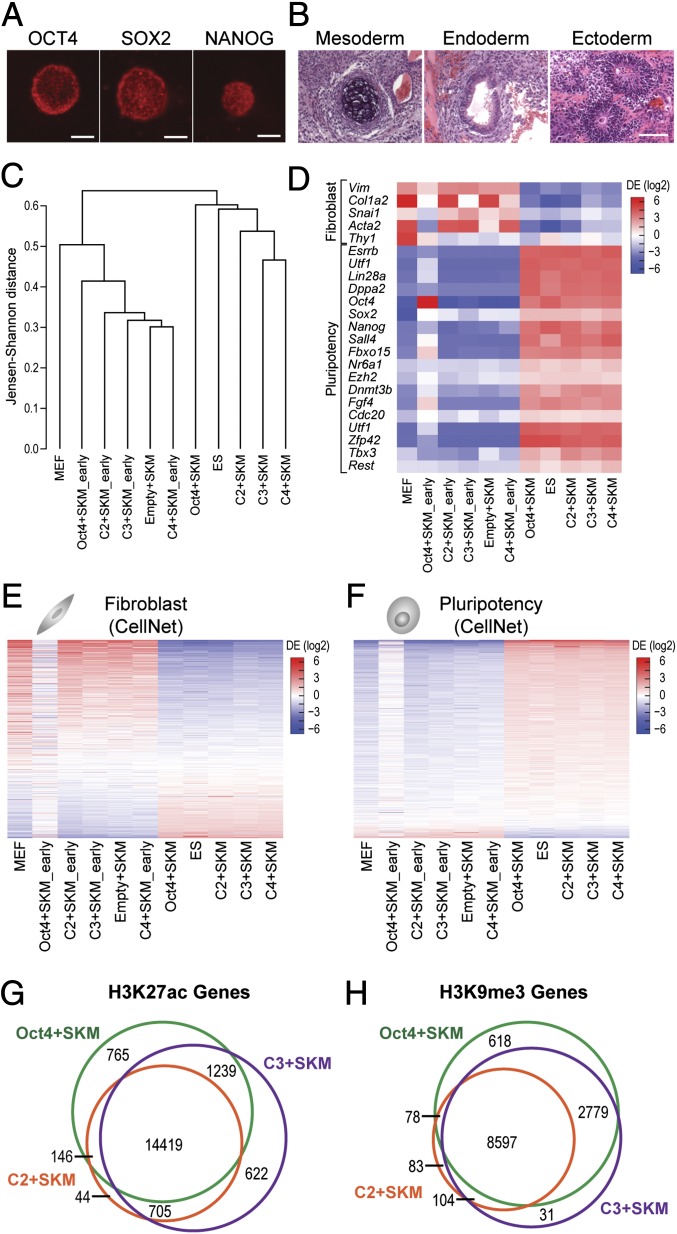
Fig. 3.
iPS cells generated with ATFs are pluripotent. (A) Immunofluorescence staining of C2+SKM iPS colonies with OCT4, SOX2, and NANOG. (Scale bars, 100 μm.) (B) Teratoma assay results show differentiation into mesoderm, endoderm, and ectoderm. (Scale bar, 100 μm.) (C) iPS cells generated with ATFs cluster with mouse ES cells and iPS cells generated with Oct4+SKM. Samples marked early are MEFs transduced with the indicated factors before conversion into iPS cells between days 18 and 27 (n = 3 or 4). (D) A heat map of fibroblast and pluripotency markers of iPS cells generated with ATFs shows down-regulation of fibroblast genes and up-regulation of pluripotency genes. Scale displays differential expression log2(ratio relative to mean). (E) A heat map of 853 genes from the CellNet fibroblast gene regulatory network (GRN) show iPS cells generated with ATFs obtain transcriptional profiles similar to that of other pluripotent cells (Oct4+SKM iPS cells and ES cells). Scale displays differential expression log2(ratio relative to mean). (F) A heat map of 705 genes from the CellNet pluripotency GRN show iPS cells generated with ATFs have expression profiles similar to that of other pluripotent cells. Scale displays differential expression log2(ratio relative to mean). (G) H3K27ac marks, specifying active regions of chromatin, appear in a common set of genes for Oct4+SKM iPS cells, C2+SKM iPS cells, and C3+SKM iPS cells. H3K27ac peaks were annotated to genes with Homer to create Venn diagrams for genes. ChIP enrichment among treatments was determined to be significant at an FDR < 0.1 by DiffBind (n = 2). (H) H3K9me3 marks, specifying repressed regions of chromatin, appear in a common set of genes for Oct4+SKM iPS cells, C2+SKM iPS cells, and C3+SKM iPS cells. H3K9me3 peaks were annotated to genes with Homer to create Venn diagrams for genes. ChIP enrichment among treatments was determined to be significant at an FDR < 0.1 by DiffBind (n = 2).

