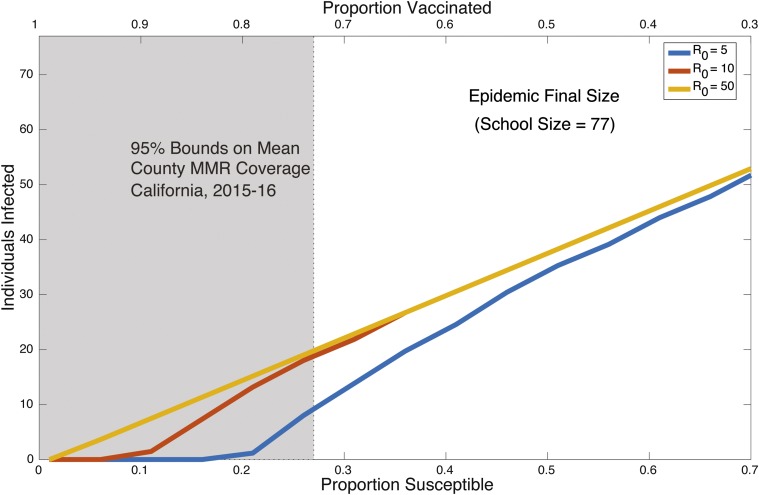
Fig. 5.
A simulation showing the variation in outbreak final size for a range of values over increasing proportion susceptible/decreasing proportion vaccinated. The shaded region indicates a 95% range of MMR (measles, mumps, and rubella) vaccination coverage in schools in California, demonstrating that the risk of outbreaks is still present in the postvaccination era (26).

