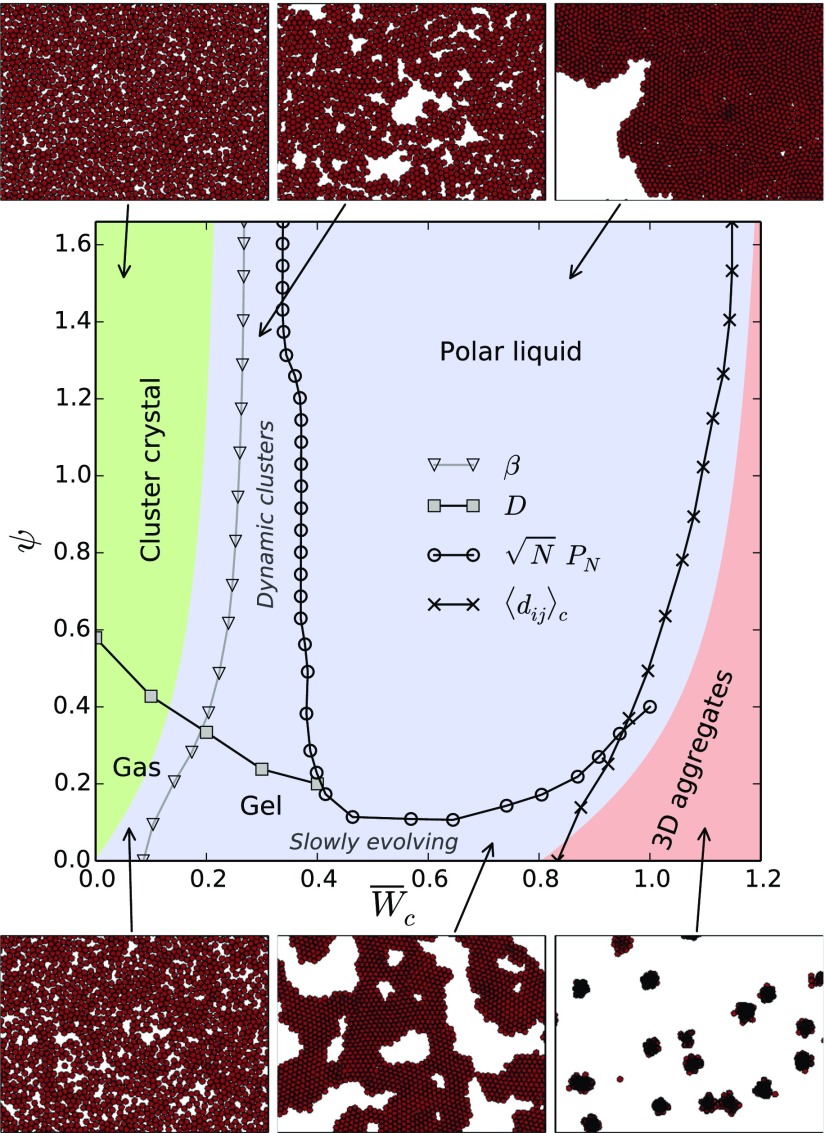
Fig. 2.
Phase behavior of cell colonies as a function of cell–cell adhesion and cell repolarization rate associated to CIL. Colors indicate the predicted regions for noncohesive (green), cohesive (blue), and overlapped (red) organizations. In addition to capturing these structural transitions, simulations allow us to identify dynamically distinct states such as an active gas, a cluster crystal, a gel-like percolated network, dynamic clusters, and an active polar liquid, as illustrated in snapshots.

