Fig. 3.
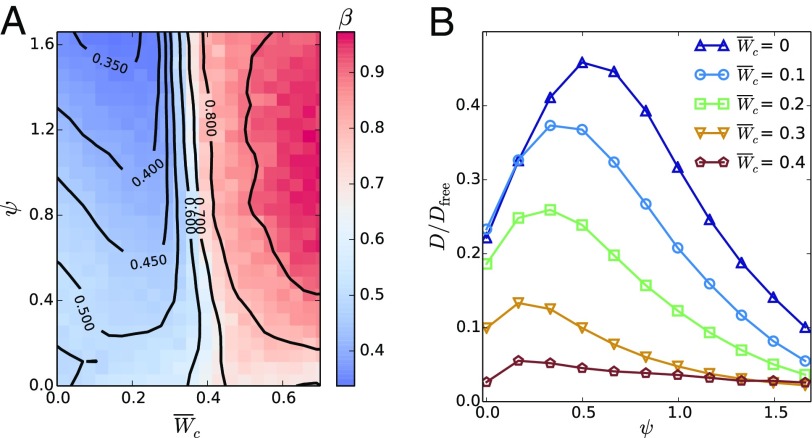
Number fluctuations and diffusion in cell colonies. (A) Exponent of number fluctuations as a function of cell–cell adhesion and CIL repolarization rate . Phase-separated states feature giant number fluctuations () whose onset identifies the transition to the cohesive phase (triangles in Fig. 2). In the noncohesive phase, colonies of slowly repolarizing cells (low ) feature equilibrium-like fluctuations (), whereas faster repolarizations (higher ) induce a hyperuniform distribution of cells (). (B) Cell diffusion coefficient as a function of for some values of . For increasing repolarization rate , initially increases but then decreases as clusters form. The maximum of identifies the onset of clustering (squares in Fig. 2). is the translational diffusion coefficient of a persistent random walker with rotational diffusion (28).

