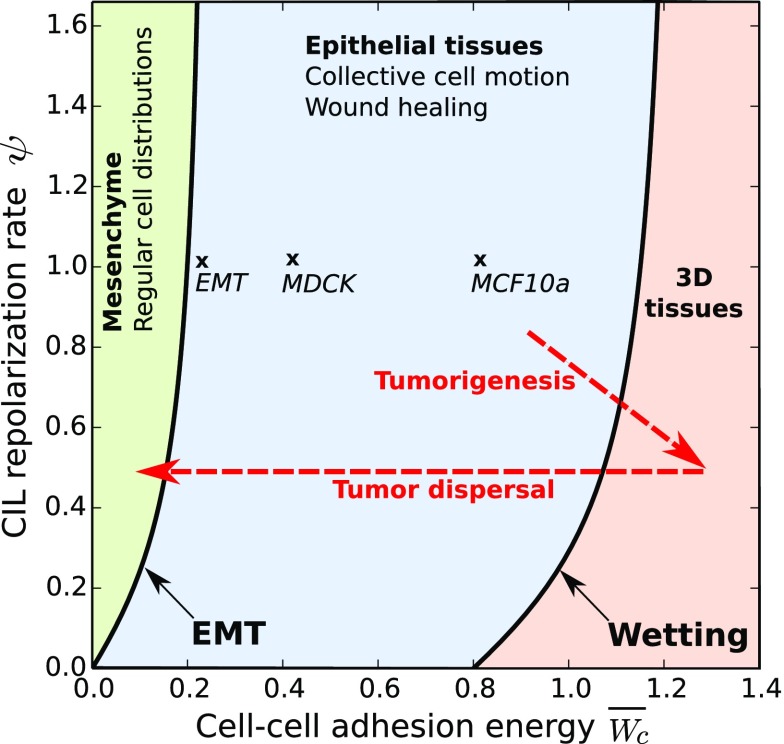
Fig. 6.
Proposal for the classification of different tissue phenotypes (boldface type) in terms of the phases of the model (colors). The association is based on the indicated features and supported by the parameter estimates for two epithelial tissues (44) and an EMT (43) (crosses and main text). Speculated trajectories in cellular interaction parameters during cancer progression are also included (dashed arrows).

