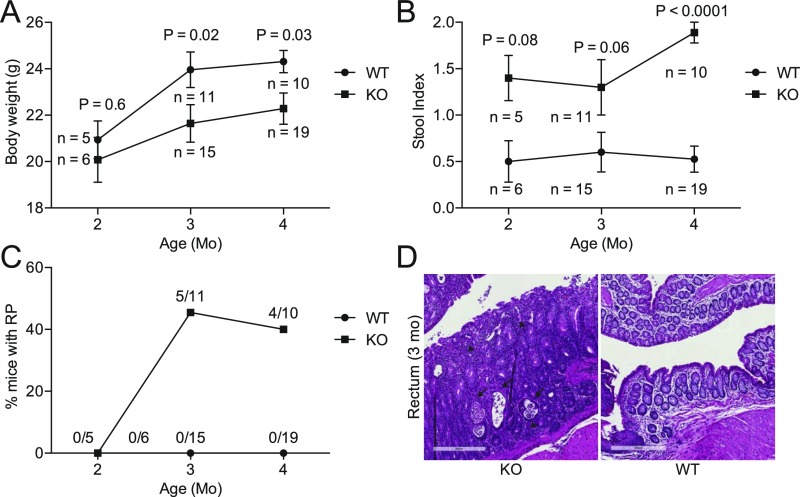
Fig. S2.
Time course of clinical inflammation. Body weight (A), stool index (B), and percent of mice with RP (C) were measured in KO and WT mice at 2, 3, and 4 mo of age. Measurements are the same as in Fig. 2. (D) Histologic evidence for active inflammation in distal colon of KO but not WT: crypt abscesses (arrows) and inflammatory infiltrate consisting of neutrophils, lymphocytes, and plasma cells (arrowheads) (n = 4 mice, < 1 y, 3 mo old mice shown). (Scale bars: 300 μM.) Number of mice indicated on graphs (A–C); P values from two-tailed Student’s t test (A) or Mann–Whitney (B); mean ± SE (A and B).

