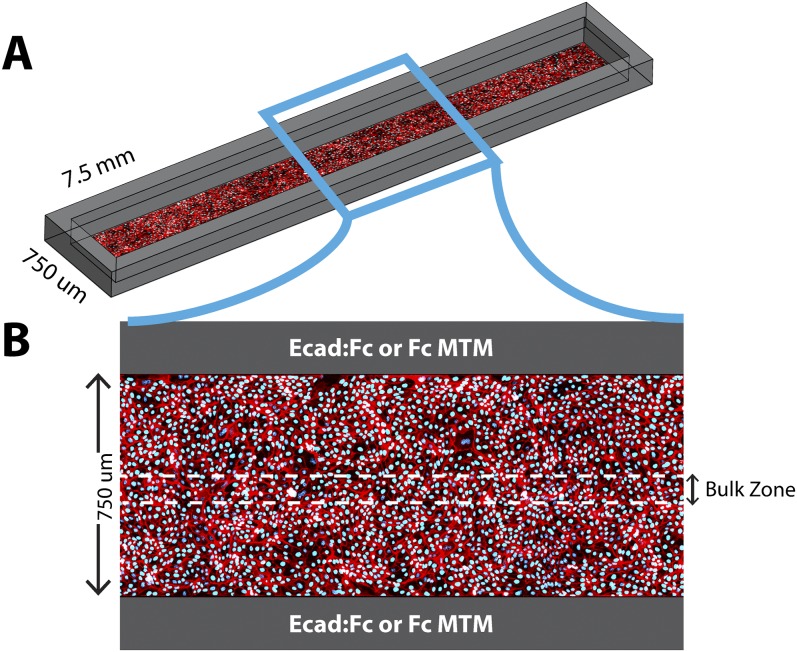
Fig. S6.
Depiction of the migration assay. (A) Three-dimensional cartoon illustrating the MTM reservoir (gray) and monolayer seeded within. (B) Close-up of the region outlined in blue. Cells analyzed were either those cells directly contacting the MTM walls or those cells within the bulk zone between the indicated dashed lines.

