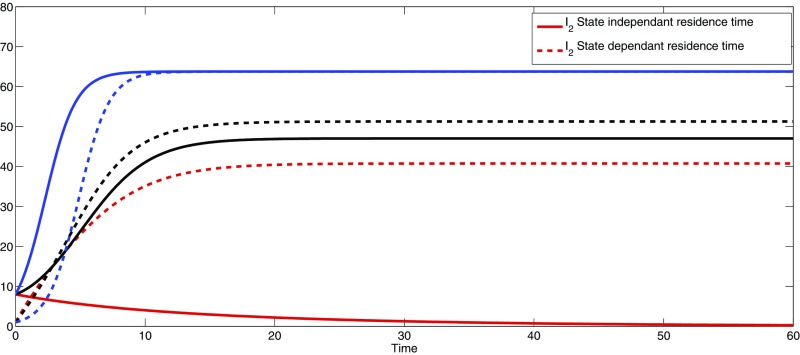
Fig. 2.
Dynamics of the disease in Patch 2. In the high-mobility case (and then ), the disease dies out (solid red curve) for constant, with . For the constant residence times matrix, the system is strangely decoupled because individuals of Patch 1 spend all their time in Patch 2, whereas individuals of Patch 2 spend all their time in Patch 1. Hence, Patch 2 individuals ( and ) are subject exclusively to the environmental conditions that define Patch 1 (), and so the basic reproduction of the “isolated” Patch 1 is and the disease dies out because . The disease persists if state-dependent (dashed red curve) as and . Figure courtesy of ref. 24.

