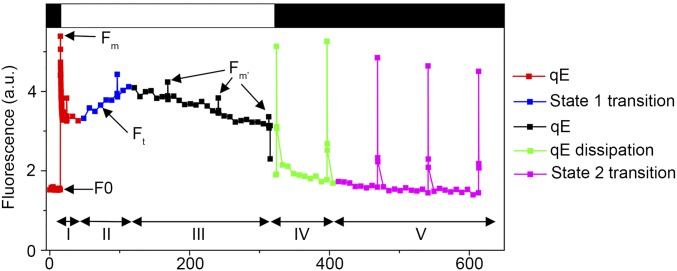
Fig. S2.
Five distinguishable phases in the fluorescence dynamics of Chlamydomonas cells. The kinetics of the WT + UV-B sample of Fig. 2A (without nigericin) is reproduced here as an illustration. Fluorescence dynamics were evaluated by using a chlorophyll fluorescence imaging system (Fluorcam; Photon Systems Instruments). The protocol included a dark preadaptation period of 5 min, a period of strong light (white bar; 5 min; 750 µmol⋅m−2⋅s−1) followed by a period of relaxation in the dark (black bar; 5 min). Maximal chlorophyll fluorescence was measured with saturating flashes (2,500 µmol⋅m−2⋅s−1) at regular 60-s intervals (to measure Fm at the end of the dark preadaptation and Fm′ during light exposure). Chlorophyll fluorescence was also monitored throughout the experiment (Fo after the dark preadaptation, Ft in the light). The approximate time ranges of the successive phases attributed to the qE and qT components of NPQ upon light exposure are indicated at the bottom of the panels with roman numerals I–V as described (33). The predominant component in each of the five phases is also highlighted in color according to the key shown in the box on the right. Upon exposure to strong light, the fast initial quenching of Fm′ is due to qE (phase I), followed by a transient increase due to a counteracting qT transition toward state 1 (phase II). When this state transition saturates, the qE component becomes more prevalent again, and Fm′ decreases (phase III). During the subsequent dark period, a rapid rise of the Fm′ peaks corresponds to the fast relaxation of qE (phase IV), followed by a Fm′ decrease due to a slower qT transition toward state 2 (phase V). a.u., arbitrary units.

