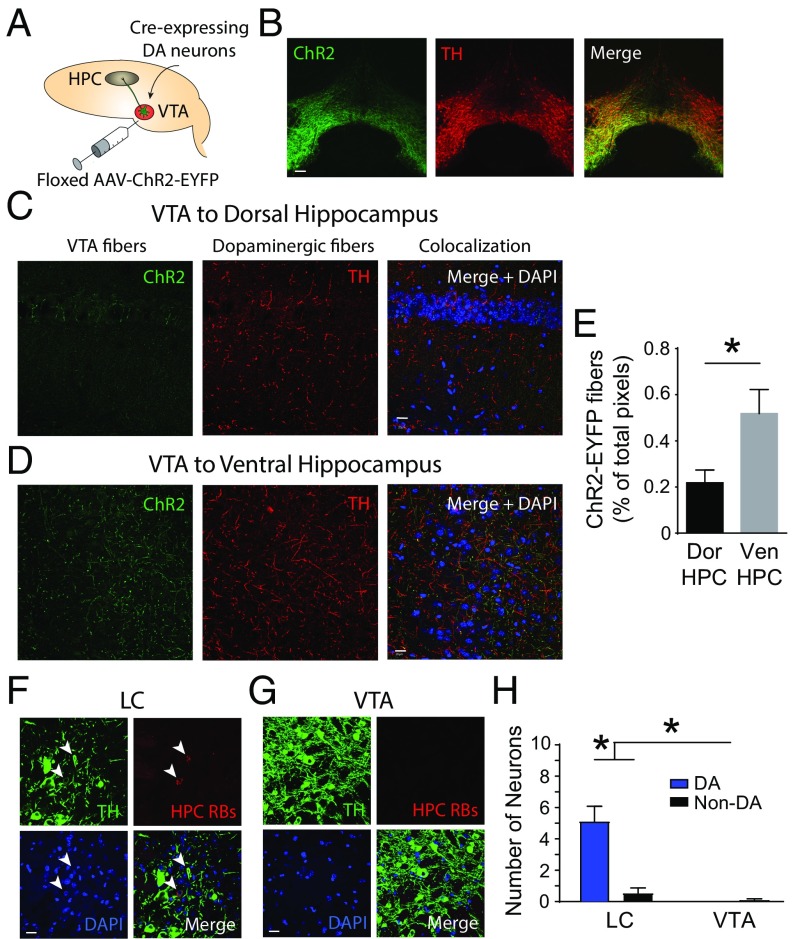
Fig. 1.
Dopaminergic projection from the VTA to the CA1 region of the dorsal hippocampus is very sparse in dopamine transporter (DAT)-IRES-Cre mice. (A) Schematic of the experimental approach depicts infection of VTA dopamine (DA) neurons and axons with ChR2-EYFP to allow for axonal tracing. AAV, adenoassociated virus; HPC, hippocampus. (B) ChR2-EYFP expression was restricted to VTA dopamine neurons. ChR2 (green) illustrates ChR2-EYFP expression, TH (red) is a dopamine marker, and Merge indicates combined signals. (Scale bar: 100 μm.) (C) ChR2+ fibers (green) indicate the dearth of dopamine-containing axons in the dorsal hippocampus originating from the VTA. (Scale bar: 20 μm.) (D) ChR2+ VTA dopamine axons are abundant in the ventral hippocampus. DAPI (blue) is a nuclear marker. (Scale bar: 20 μm.) (E) Significantly more ChR2+ fibers are found in the ventral hippocampus (Ven HPC = 0.52 ± 0.10%) versus the dorsal hippocampus (Dor HPC = 0.22 ± 0.05%) (Mann–Whitney test, *P = 0.022). (F) Neurons of the LC project to the dorsal hippocampus as indicated by (red) neurons retrogradely labeled from the dorsal hippocampus. TH (green), retrobeads from the dorsal hippocampus (HPC RBs, red), and DAPI (blue) are shown. (Scale bar: 20 μm.) (G) VTA was devoid of dorsal hippocampus-projecting dopamine neurons. (Scale bar: 20 μm.) (H) Significantly more dopamine-containing neurons in the LC versus the VTA project to the dorsal hippocampus [two-way ANOVA, LC DA = 4.92 ± 0.95, LC non-DA = 0.50 ± 0.34, VTA DA = 0, VTA non-DA = 0.08 ± 0.08; F(1,44) = 19.82; n = 12; *P < 0.001].

