Fig. 3.
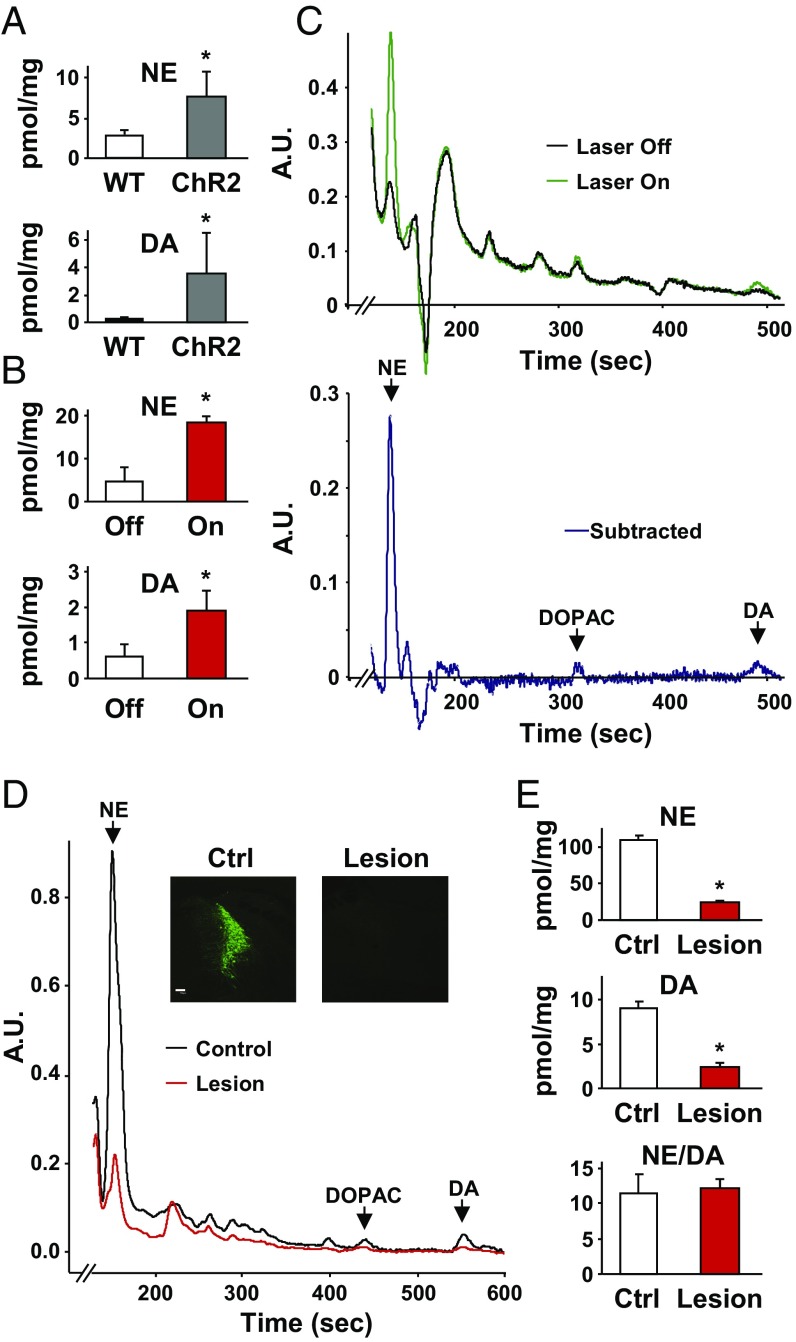
Dopamine is released from LC axons in the hippocampus. (A) Average dopamine and norepinephrine concentrations in the extracellular fluid of photostimulated hippocampal slices from mice expressing ChR2 in LC axons and their non-ChR2–expressing littermates [wild-type (WT): DA = 0.11 ± 0.05, norepinephrine (NE) = 3.05 ± 0.22, n = 3; ChR2: DA = 3.57 ± 1.14, n = 7; Student’s t test, *P = 0.017). (B) Higher dopamine and norepinephrine levels were also measured in the supernatant of ChR2-expressing hippocampal slices that were optically stimulated (On) versus unstimulated (Off) controls (nonstimulated: DA = 0.60 ± 0.18, NE = 4.75 ± 1.65, n = 4; stimulated: DA = 1.88 ± 0.29, NE = 18.25 ± 0.85, n = 4; Student’s t test, *P = 0.029). (C) Representative HPLC traces show clear peaks for norepinephrine, dihydroxyphenylacetic acid (DOPAC), and dopamine in the extracellular fluid of stimulated slices versus nonstimulated controls. A.U., arbitrary units. (D) HPLC trace of hippocampal tissue samples from animals with a unilateral, Caspase-3–induced lesion of catecholamine neurons in the LC. (Insets) TH staining of the LC region. (Scale bar: 100 μm.) (E) Both dopamine and norepinephrine tissue levels in the dorsal hippocampus were nearly eliminated by lesioning LC catecholamine neurons. (Control: DA = 9.06 ± 0.64, NE = 108.96 ± 6.32, n = 5; Lesion: DA = 2.47 ± 0.49, NE = 24.85 ± 1.22, n = 5; Student’s t test, P < 0.001). The ratio of norepinephrine to dopamine was the same in control and lesioned hemispheres (Control: 11.67± 2.49, Lesion: 12.29 ± 1.16; *P > 0.05).

