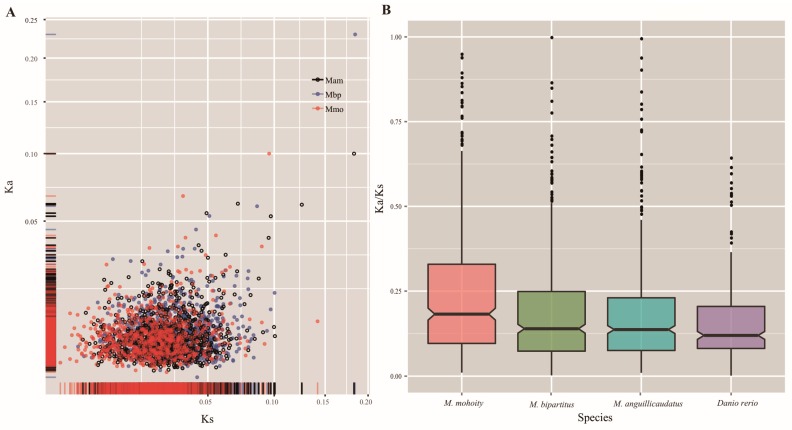
Figure 3.
The Ka, Ks, and Ka/Ks ratios for terminal branches were estimated from each orthologous genes in three loaches. (A) Scatter plot of Ka and Ks in three loaches based on the free-ratio model; (B) The distribution of Ka/Ks ratios for terminal branches. D. rerio was selected as a representative. Mam, Mbp, and Mmo in (A) indicate M. anguillicaudatus, M. bipartitus and M. mohoity, respectively.

