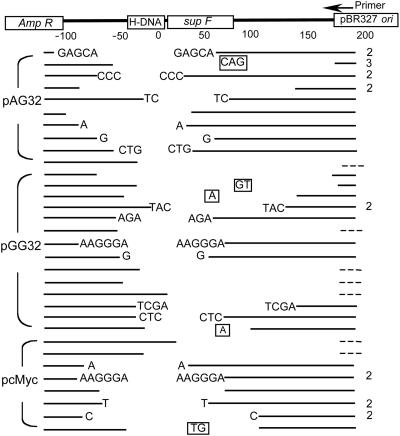
Fig. 3.
Diagram of deletion mutants. Sequences surrounding the inserted H-DNA-forming sequences are shown at the top of the figure. The blank areas between the lines indicate deletions. Boxed letters represent additional bases inserted. Letters at the ends of the blank areas indicate microhomologies at the junctions. Because the microhomologies cannot be assigned unambiguously to the left or right of the deleted sequence, we have listed them on both ends, although only one copy is present in the sequence of the junction. Broken lines indicate deletions that extended near the primed region. The number at the right of the line indicates the number of identical mutants identified.

