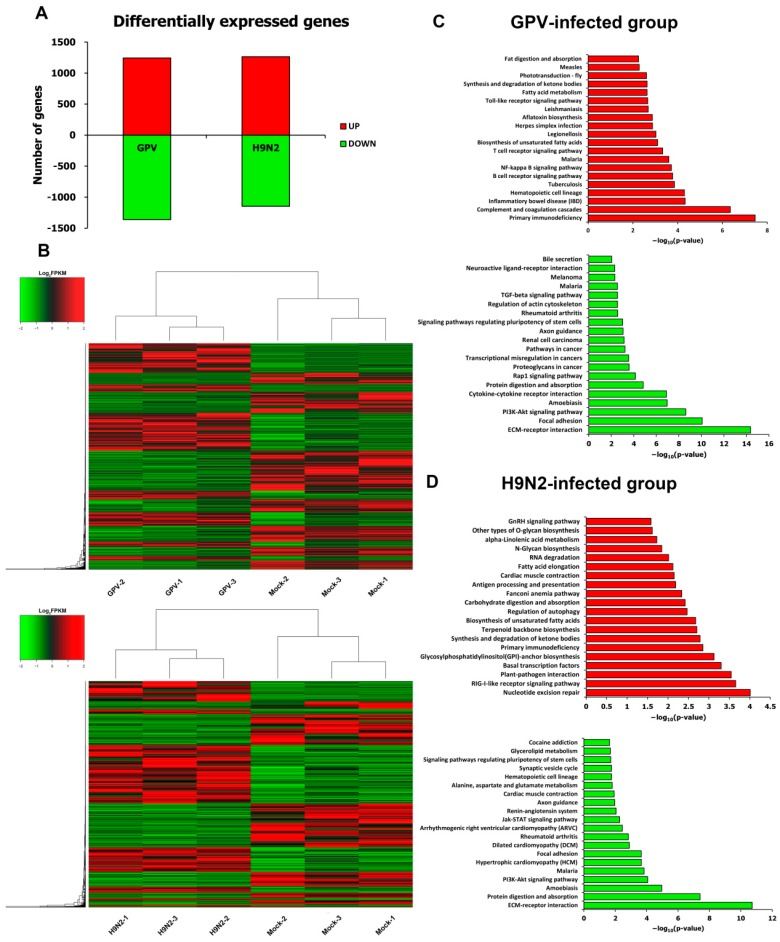
Figure 2.
Analysis of the differentially expressed genes after infection with GPV and H9N2. (A) The number of differentially expressed genes after infection with GPV and H9N2; (B) hierarchical clustering analysis of differentially expressed genes in the GPV- and H9N2-infected groups; (C) KEGG enrichment analyses of the up- (red bar chart) and down-regulated genes (green bar chart) in the GPV-infected groups; and (D) KEGG enrichment analyses of the up-(red bar chart) and down-regulated genes (green bar chart) in the H9N2-infected groups. Only the top 20 pathways are listed here.

