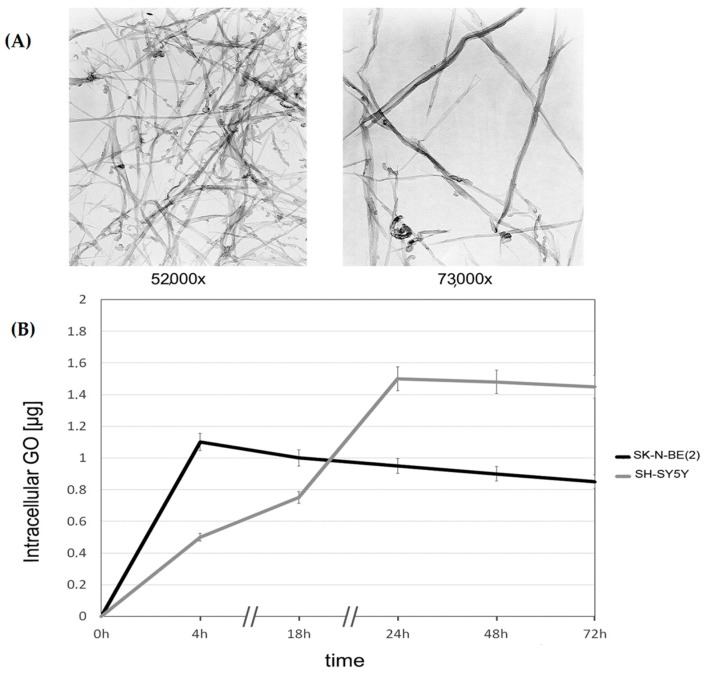
Figure 1.
Uptake of graphene oxide (GO) nanoparticles: (A) characterization of nanoribbons by Transmission Electron Microscopy (TEM) (left: 52,000× magnification; right: 73,000× magnification); and (B) uptake of GO nanoparticles in SK-N-BE(2) and SH-SY5Y cells in 72 h. Data are obtained from spectophotometer readings (OD 340) of supernatants at different times. Concentrations of GO were obtained by subtracting amounts present in supernatants from an initial (T0) concentration of 2 µg/mL.

