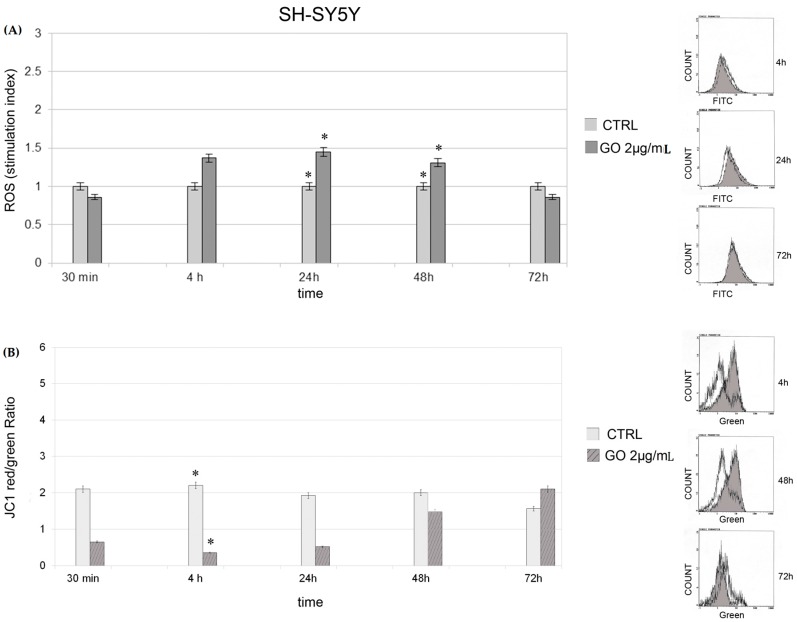
Figure 4.
ROS production and JC1 dye in SH-SY5Y cells: (A) ROS production in SH-SY5Y cells at different times of GO exposure The mean fluorescence intensity was detected and expressed as stimulation index obtained by ratio between ROS levels in treated cells divided by ROS in control cells. Data are the mean ± SD of three different experiments. On the right of the panel, there are indicative fluorescence peaks of control cells and GO treated cells at indicated times. Grey peaks refer to GO treated cells. * p < 0.05 for each exposure condition compared to unexposed control (CTRL). (B) JC1 dye in SH-SY5Y cells at different times of GO exposure. Data are expressed as mean of red/green ratio of three different experiments ± SD. On the right of the panel, there are indicative peaks of green fluorescence (referring to depolarized cells) of control cells and GO treated cells at indicated times. Grey peaks refer to graphene treated cells. * p < 0.05 for each exposure condition compared to unexposed control (CTRL).

