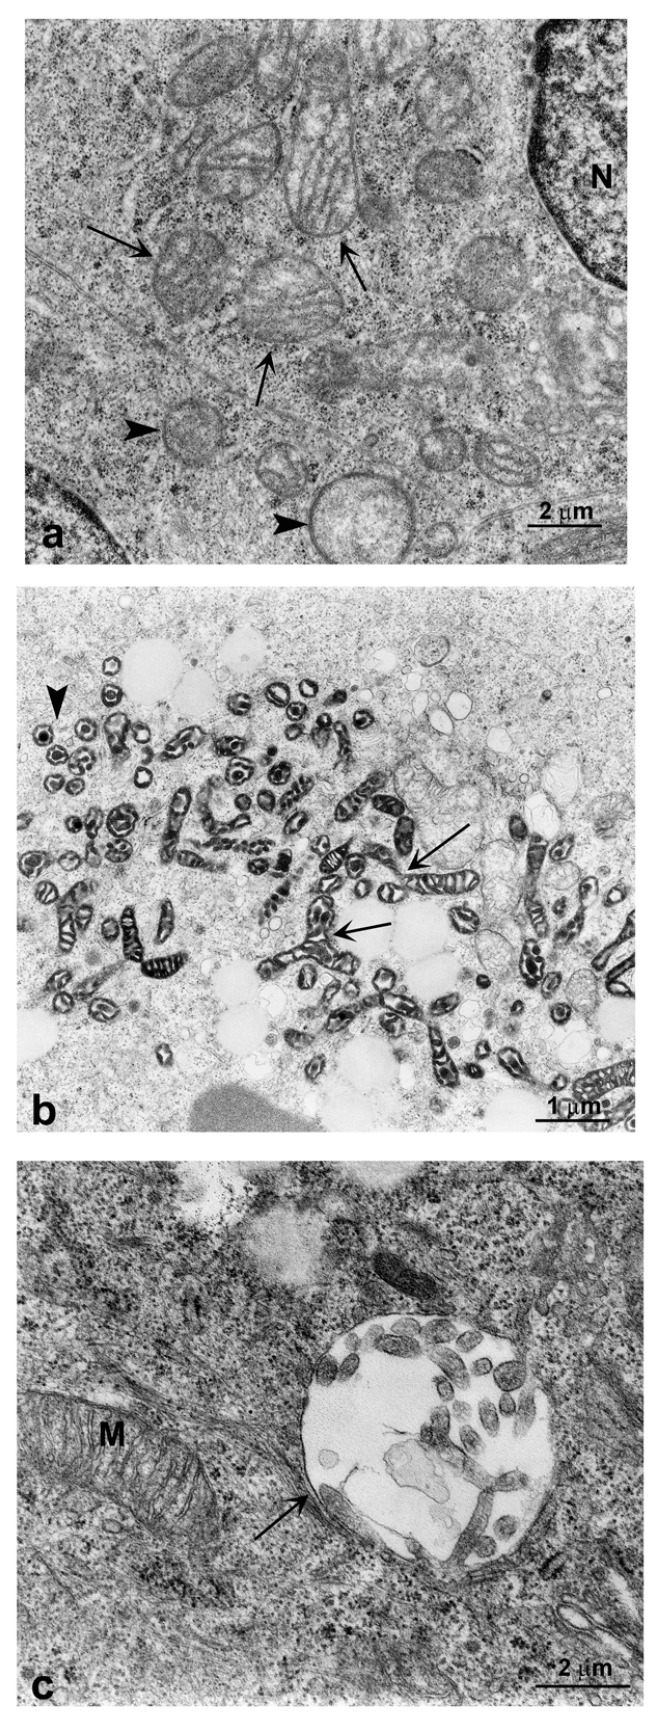
Figure 5.
TEM images of autophagosomes in GO-treated SK-N-BE(2) cells: (a) SK-N-BE(2) cells at 48 h of GO treatment. Swollen mitochondria are visible. The matrix shows a decrease in electron density and an increase in volume. Sometimes the cristae appear disorganized (arrows). Disorganized mitochondria are also visible (arrowhead) (21,000×); (b) At 72 h of GO treatment the mitochondria are polymorphic, in condensed conformation (low energy state and high level of oxidative phosphorylation) with high electron density and decreased volume, intramembranes and intracristal space. Some fused mitochondria are visible (arrows) (11,500×); (c) Autophagosome (arrow) containing disorganized mitochondria (mitophagy) in SK-N-BE(2) cells at 72 h of incubation with GO (28,500×). N = nucleus; M = mitochondria. Images were taken by using a Philips CM-10 Trasmission Electron Microscopy as described under Materials and Methods.

