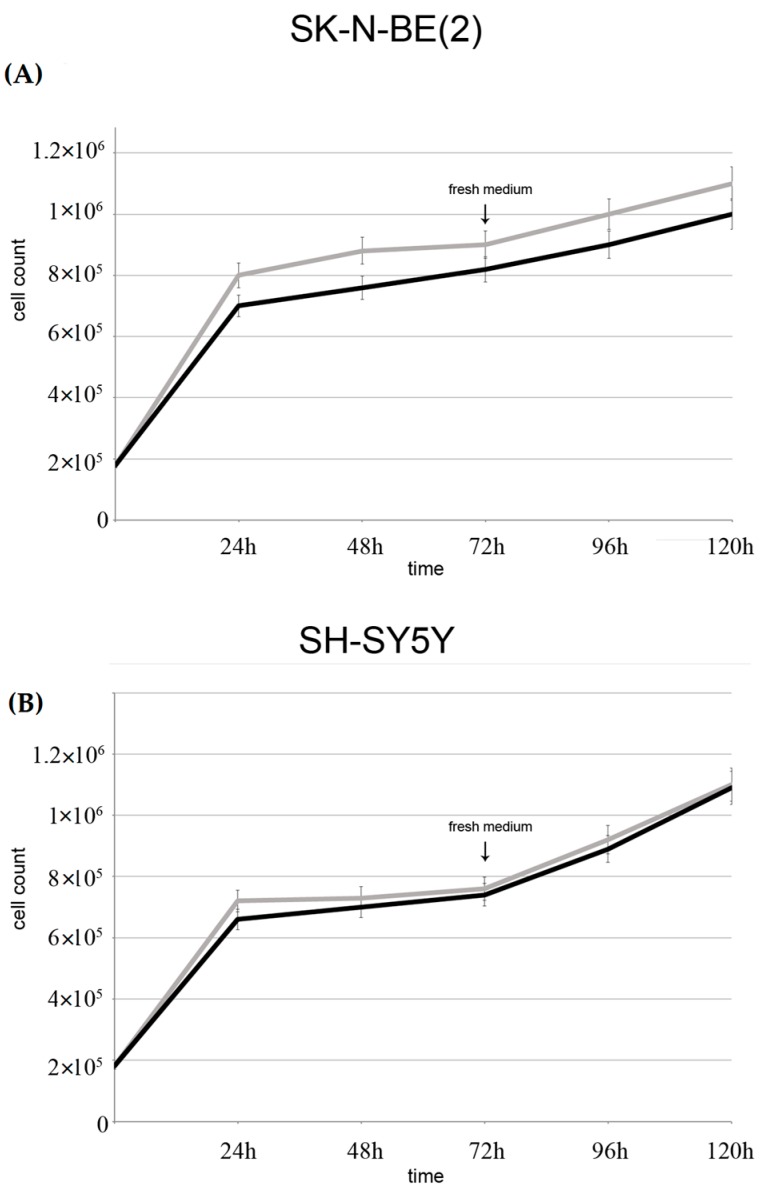
Figure 8.
Growth curves of SK-N-BE(2) and SH-SY5Y cells: SK-N-BE(2) (A) cells; and SH-SY5Y cells (B) were treated with GO (2.0 μg/mL) for up to 72 h. Medium was changed at 72 h and cultures were allowed to grow for 96 and 120 h. At the end of incubation time, cells were stained with Trypan blue dye and counted on a hemocytometer. Data are mean of three independent experiments ± SD.

