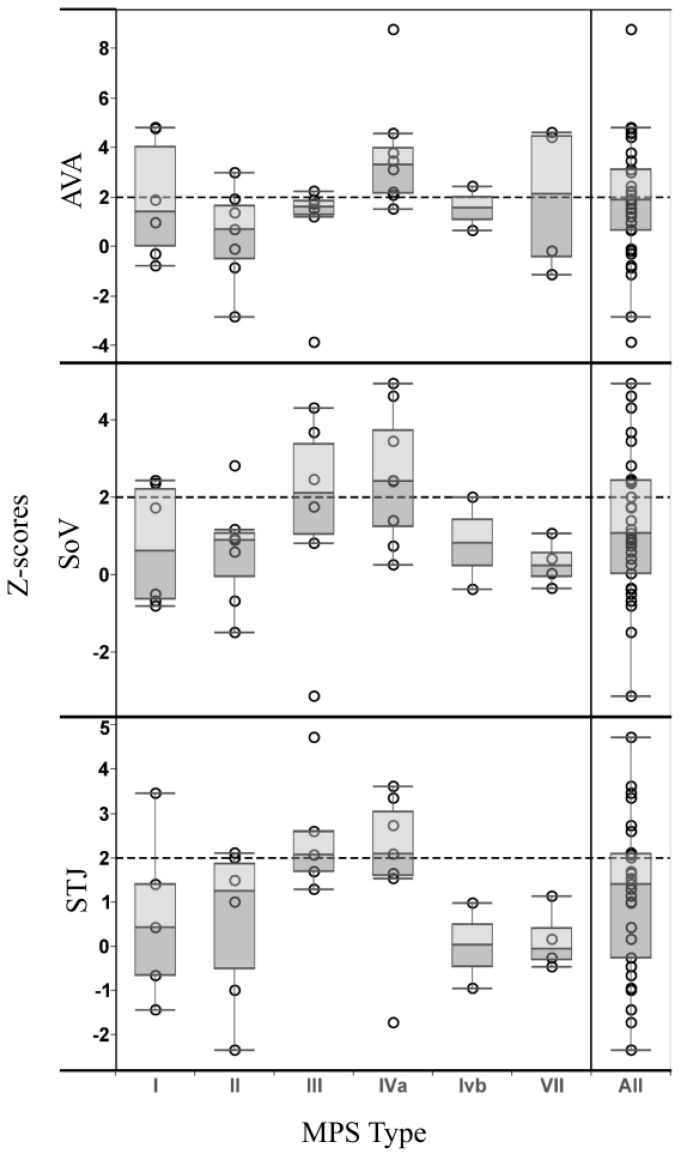
Figure 1.
Z-scores of aortic root measurements for subtypes of mucopolysaccharidosis patients in a Tukey boxplot. The open circles represent the z-score of each individual patient at the AVA (aortic valve annulus), SoV (sinuses of Valsalva), and STJ (sinotubular junction). The 25–75th percent interquartile range is represented by the edges of the box. The circular points above the dotted line indicate aortic root measurements that exceed the 97th percentile of normal measurements.

