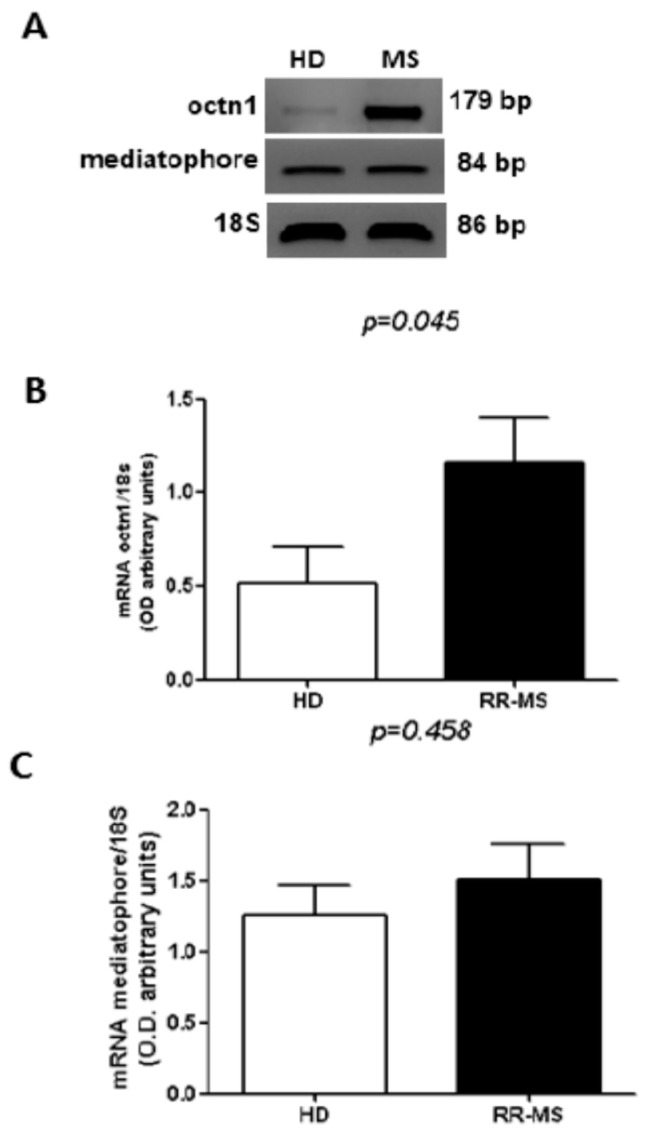
Figure 3.
Expression of cholinergic markers in PBMC of RR-MS and HD. (A) A representative RT-PCR analysis of mediatophore and OCTN-1 performed in MS patients and HD; (B) densitometric analysis of the bands of OCTN-1 expressed in RR-MS and HD (n = 15); (C) densitometric analysis of the bands of mediatophore expressed in RR-MS and HD (n = 15). The bars represent the standard error (p-values reported in figure are relative to comparison between groups).

