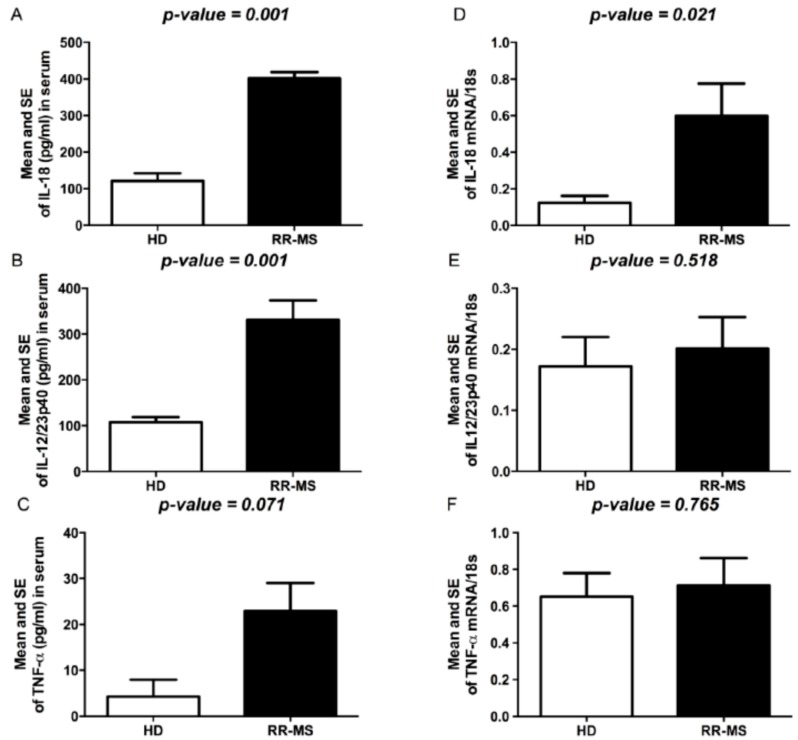
Figure 4.
Cytokine levels in serum of RR-MS and HD. (A) IL-18 levels (pg/mL); (B) IL-12/IL-23p40 levels (pg/mL); (C) TNFα levels (pg/mL). Cytokine expression in PBMC of RR-MS and HD; (D) IL-18; (E) IL-12/IL-23p40; (F) TNFα 18S was used as housekeeping gene. The bars represent the standard error (p-values reported in figure are relative to comparison between groups).

