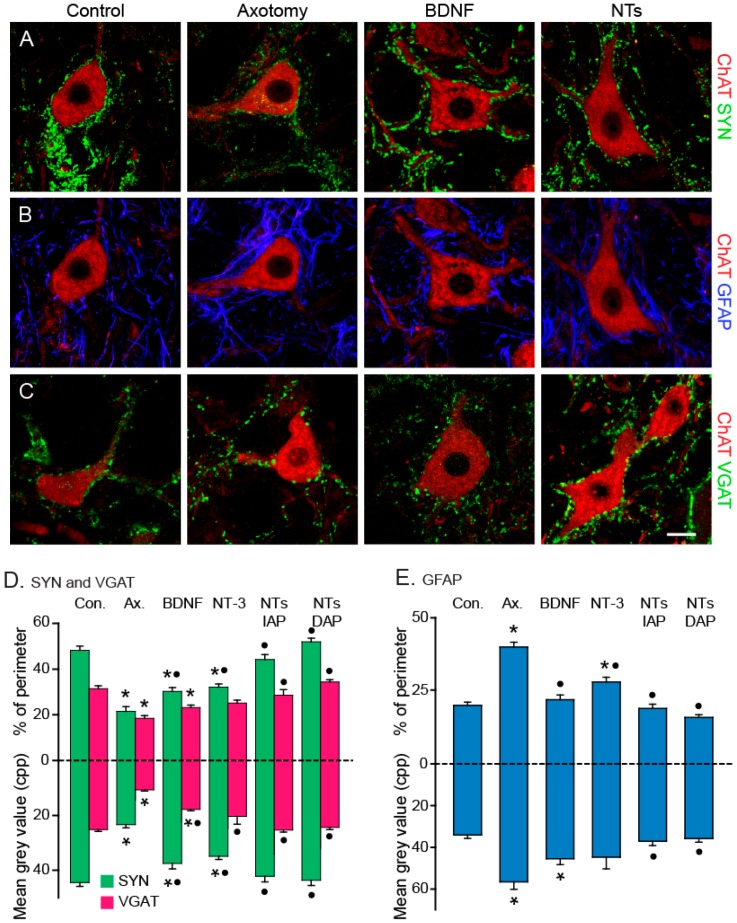
Figure 6.
Neurotrophin involvement in prevention of synaptic stripping: (A) Confocal high-magnification images of motoneurons in control, axotomy, and after treatment with BDNF or with the mixture of BDNF+NT-3 (NTs), illustrating the synaptophysin (SYN) innervation in green and the motoneuronal cell body in red (ChAT). All images were obtained from animals after 15 days of axotomy alone or after treatment with neurotrophins in an immediate administration protocol (IAP); (B) Same treatments as in (A), but for GFAP coverage; (C) Confocal images of VGAT labeling in ChAT-identified motoneurons. Calibrations bar: 10 µm for (A–C); (D) Changes in SYN-immunoreactive (IR; green) and VGAR-IR (Simbols to be erased) boutons in the abducens nucleus after axotomy (Ax.) and different treatments (Con., control). Up-directed bars represent the percent of covered perimeter of the motoneurons in control, axotomy, single neurotrophin treatment (BDNF or NT-3) and double neurotrophin treatment for either IAP or delayed administration protocol (DAP). Down-directed bars correspond to measurements in the neuropil. Bars represent mean ± SEM for 15–46 motoneuronal profiles in each group and 26 to 50 measurements in the neuropil; (E) Same as in (D) but for measurements of GFAP-IR profiles around somata (up directed bars) or in the neuropil (down-directed bars). Asterisks indicate significant differences with control, whereas dots indicate significant differences with axotomy. Two way ANOVA, Holm–Sidak method for pairwise multiple comparisons (p < 0.01). Modified from [105].

