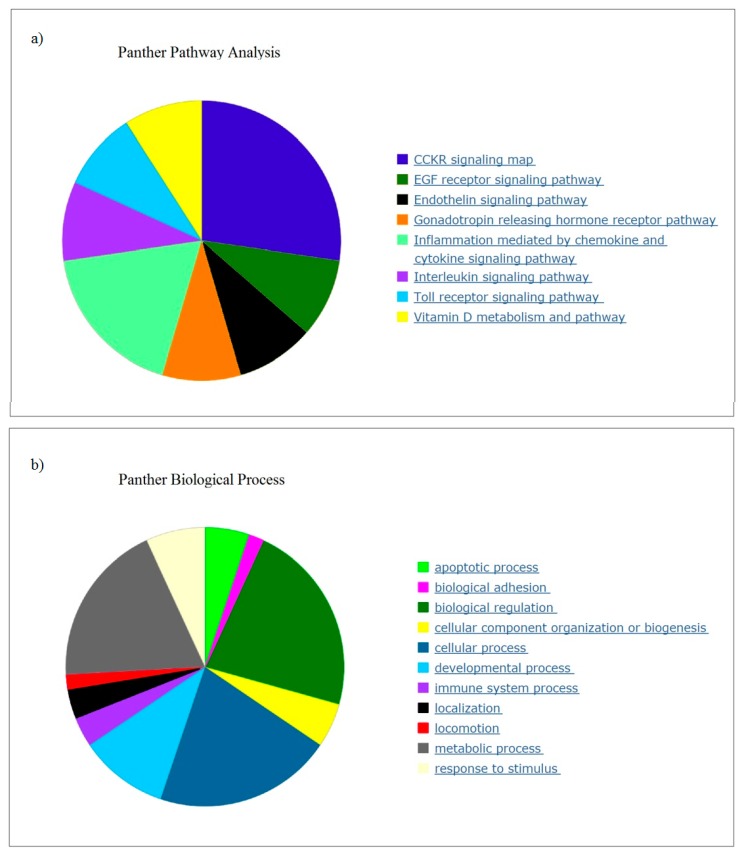
Figure 1.
Gene classification pie charts created in PANTHER (Protein ANalysis THrough Evolutionary Relationships). (a) pathways; and (b) biological process associated with the >1.4-fold change (FC) gene expression change in response to olive leaf extract (OLE) consumption. The key names the pathways (starting from the top and moving clockwise) that have been regulated with OLE relative to placebo (PBO).

