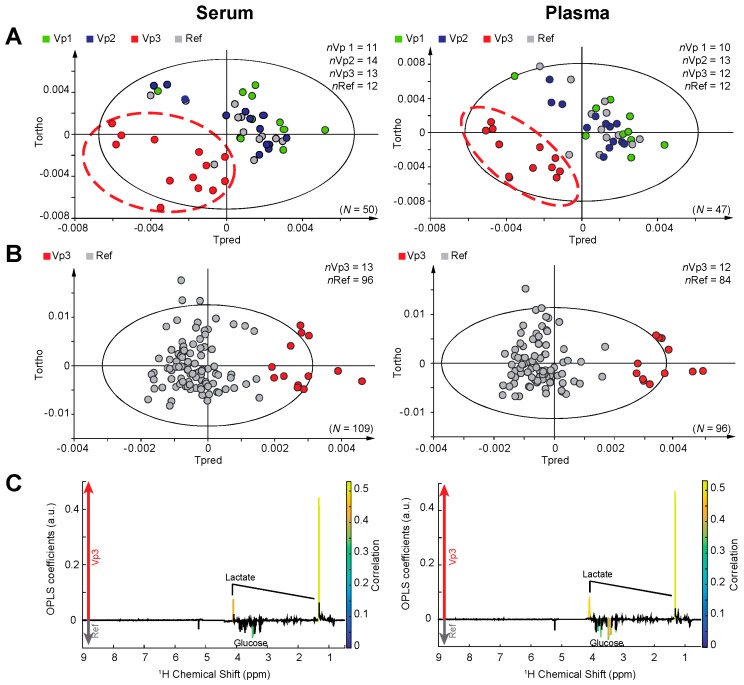
Figure 1.
Impact of the delay and storage temperature between blood draw and centrifugation on plasma and serum metabolic profiles. (A) Partial least squares discriminant analysis (PLS-DA) model for serum cohort, discriminating variant (Vp) 1, Vp2, Vp3 and a reference (Ref) group (N = 50, nVp1 = 11, nVp2 = 14, nVp3 = 13, nRef = 12, 1+1 components, R2Y = 0.267, Q2 = 0.192) and for plasma cohort (N = 47, nVp1 = 10, nVp2 = 13, nVp3 = 12, nRef = 12, 1+1 components, R2Y = 0.283, Q2 = 0.204). The Ref group corresponds to a random mix of samples collected according to the reference protocol Patients in the Ref group also underwent the variant protocol Vp1, Vp2 or Vp3; (B) Orthogonal projections to latent structures (OPLS) model for serum cohort, discriminating Vp3 vs. Ref samples (N = 109, nVp3 = 13, nRef = 96, 1+2 components, R2Y = 0.7, Q2 = 0.652, ANOVA of the cross-validated residuals (CV-ANOVA) p-value = 2.7 × 10⁻²¹); OPLS model score plot for plasma cohort, discriminating samples Vp3 vs. Ref samples (N = 96, nVp3 = 12, nRef = 84, 1+2 components, R2Y = 0.796, Q2 = 0.771, CV-ANOVA p-value = 1.9 × 10⁻²⁶); (C) OPLS loading plot is represented for Vp3 vs. Ref serum samples; OPLS loading plot is represented for Vp3 vs. Ref plasma samples. Statistically significant individual signals correspond to the color spectral regions. Tpred and Tortho correspond to the predictive component and orthogonal component of the OPLS model, respectively.

