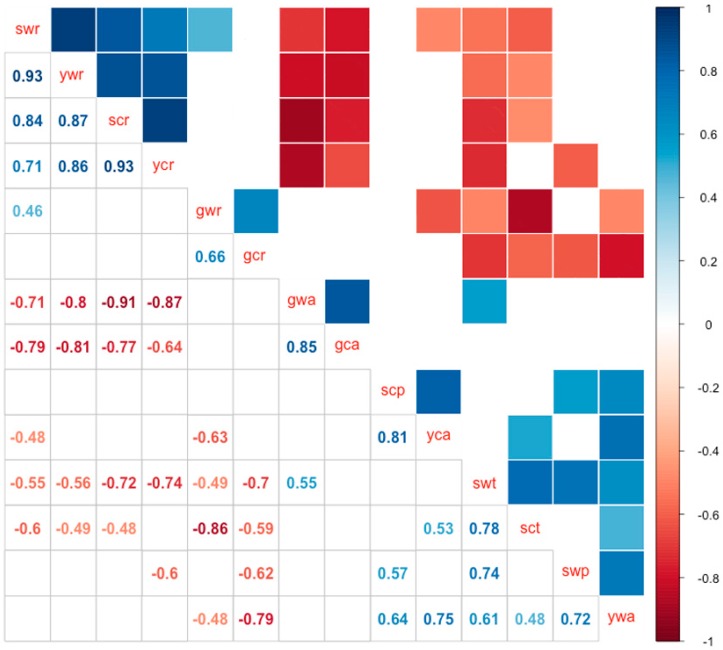
Figure 2.
Pairwise correlation matrix of differentially-expressed miRNAs across tissue types, developmental stages, and wild and cultivated accessions. Pearson correlations between pairwise samples among all 14 experimental conditions were calculated by considering differentially-expressed miRNAs between each pairwise comparison as the distance between the two conditions. Blue boxes indicate positive correlation values (0 ≤ r ≤ 1; with 1 being complete positive correlation) and red boxes represent negative correlation values (−1 ≤ r ≤ 0, with −1 being complete anti-correlation) between samples. Correlation with p-values >0.1 are not shown in this matrix. The order of the rows was determined by the hierarchical clustering of the correlation matrix. Closely-related conditions, such as conditions with the same type of tissues, were therefore grouped together. “gca” and “gcr”: aerial part and roots, respectively, of germinated seedlings of C08; “yca” and “ycr”: aerial part and roots, respectively, of young seedlings of C08; “sct”: trifoliates of C08 seedlings; “scp” and “scr”: Primary leaves and roots, respectively, of C08; “gwa” and “gwr”: aerial part and roots, respectively, of germinated seedlings of W05; “ywa” and “ywr”: Aerial part and roots, respectively, of young seedlings of W05; “swt”: Trifoliates of W05 seedlings; “swp” and “swr”: Primary leaves and roots, respectively, of W05.

