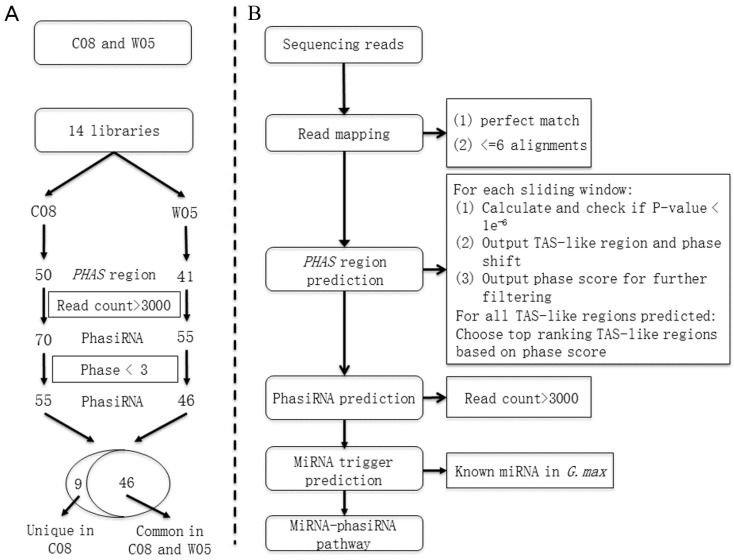
Figure 4.
The pipeline for phasiRNA predictions: (A) The workflow for the comparisons between the phasiRNA profiles of C08 and W05. The numbers of common and unique phasiRNAs are shown in the Venn diagram; (B) The workflow for phasiRNA identification. Sequencing reads were mapped to the reference genome Gmax_275_Wm82.a2.v1 and only those reads that could be mapped to at most six positions on the reference genome with perfect matches were used. A sliding-window method was then applied to predict genome-wide PHAS regions using the pattern of mapped reads based on the ranking of p-values and phase scores. In each predicted PHAS region, loci with on-phase high-count reads (generating phasiRNAs >3000 total reads in seven sample of each variety) were selected and regarded as putative phasiRNA-generating loci. A characterization of each putative phasiRNA was performed to identify any possible miRNA triggers that initiated the biogenesis of phasiRNAs. The final product was a proposed pathway for each miRNA–phasiRNA pair.

