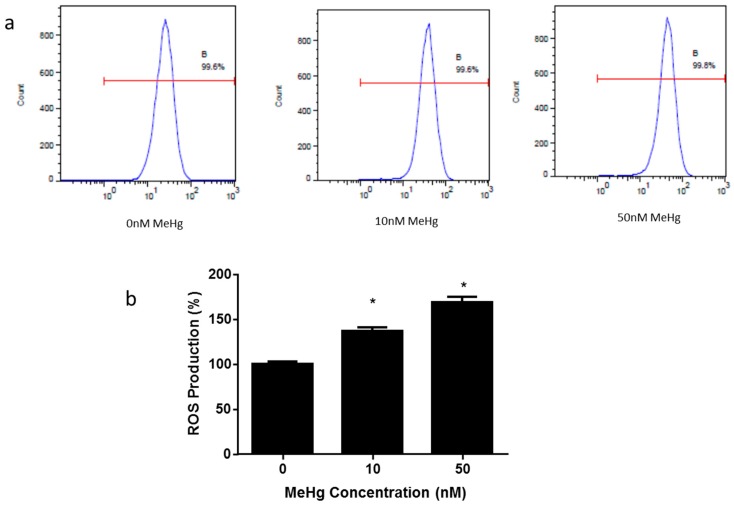
Figure 3.
Effect of MeHg on the production of reactive oxygen species (ROS) in ihNPCs. Cells were treated with 0 nM, 10 nM, and 50 nM MeHg, and the level of ROS was analyzed. (a) ROS levels after MeHg treatment were analyzed by flow cytometry; (b) The relative ROS levels were presented as fold differences based on those at 0 nM. Results are expressed as mean ± SEM (n = 3). * p < 0.05 when compared with the corresponding control group (0 nM MeHg).

