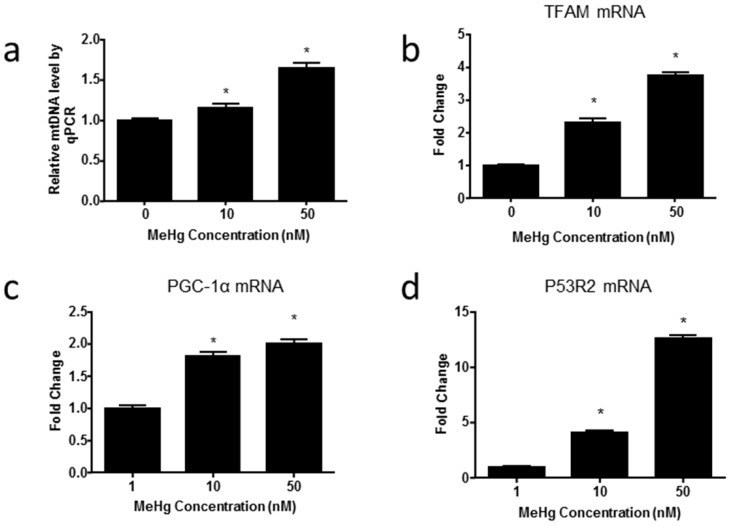
Figure 4.
MeHg alters the expression of genes regulating mitochondrial biogenesis (a) The relative mitochondrial DNA (mtDNA) were presented as fold differences based on control. Results are expressed as mean ± SEM (n = 3). * p < 0.05 when compared with the corresponding control group (0 nM MeHg); (b–d) qPCR analysis of peroxisome-proliferator-activated receptor gammacoactivator-1α (PGC-1α), mitochondrial transcription factor A (TFAM) and p53-controlled ribonucleotide reductase (p53R2) mRNA expression levels performed on RNA extracted from ihNPCs treated with 0 nM, 10 nM and 50 nM of MeHg. Relative mRNA levels were presented as fold differences based on control. Results are expressed as mean ± SEM (n = 3). * p < 0.05 when compared with the corresponding control group (0 nM MeHg).

