Figure 2.
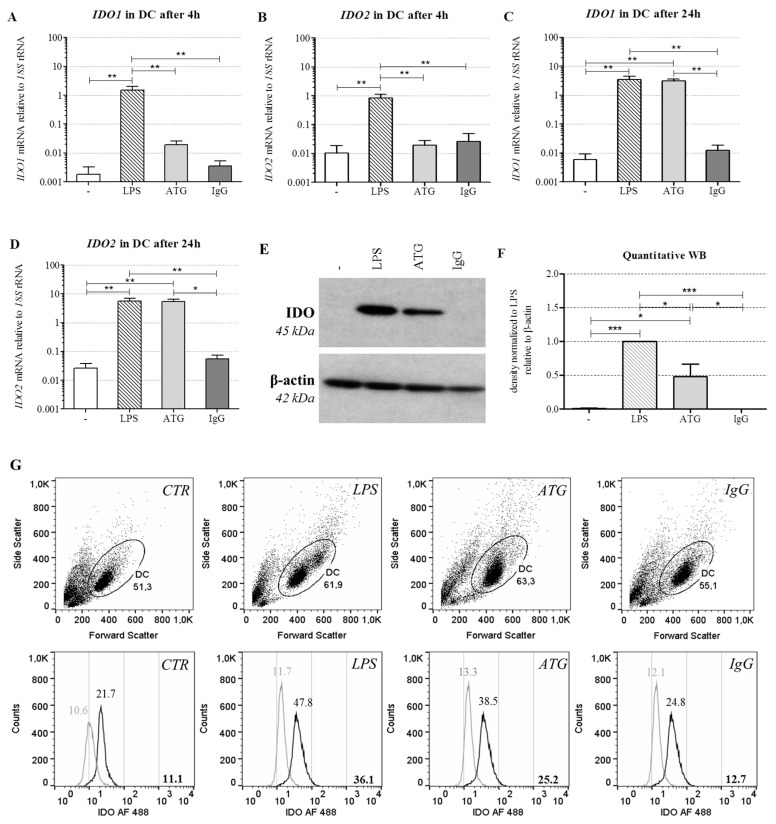
ATG induces IDO in DC at the mRNA and protein level. Monocyte-derived DC were cultivated with or without LPS (10 ng/mL), ATG (100 µg/mL), and IgG isotype control (100 µg/mL), respectively. (A–D) After 4 h and 24 h, mRNA expression of IDO1 (A,C) and IDO2 (B,D) was analyzed by means of quantitative real-time PCR relative to 18S rRNA expression. Data are means ± SEM (n ≥ 3); (E) After 48 h, Western blot analysis was performed using antibodies against IDO and β-actin. Shown is one representative out of five independent experiments; (F) Densitometric analysis of five different experiments (normalized to the LPS signal). Data are means ± SEM; (G) Cells were harvested after 48 h, washed, and stained with Alexa Fluor (AF) 488-conjugated monoclonal anti-IDO antibody and the suitable isotype. Shown is a dot blot of the respective cell populations and overlaid histograms of the isotype (grey) and the anti-IDO antibody (black) of one representative of six experiments. Numbers indicate the median fluorescence of IDO, bold numbers in the lower right corner indicate the difference median fluorescence IDO—median fluorescence isotype. Statistical analysis was performed using one-way ANOVA (* p ≤ 0.05, ** p ≤ 0.01, *** p ≤ 0.001).

